Newark Home Prices: $357K, Up 3.1% — 3 ZIPs Analyzed (2026)
$357,387. That’s what a typical home costs in Newark, Delaware right now. Prices are up 3.1% from a year ago, and the upward trend has held steady for 12 straight months. For a small college city in the Philly metro, that puts Newark in an interesting position — not cheap, but still well below the regional average.
Quick answer: The average home price in Newark, DE is $357,387 as of February 2026, up 3.1% year over year according to Zillow.
Current Home Prices in Newark
Here’s where things stand as of February 2026:
| Metric | Value |
|---|---|
| Median Home Price | $357,387 |
| Year-over-Year Change | +3.1% |
| Lowest ZIP Median | $309,956 |
| Highest ZIP Median | $414,485 |
| ZIP Codes Tracked | 3 |
The $357K median means Newark sits in a middle zone for the Philadelphia-Camden-Wilmington metro area. A 3.1% annual gain translates to roughly $10,700 in added equity over the past year. That’s meaningful — but it’s not runaway appreciation.
The gap between the cheapest and priciest neighborhoods is about $104,500. For a city with only three tracked ZIP codes, that’s a wide spread. Where you buy within Newark matters.
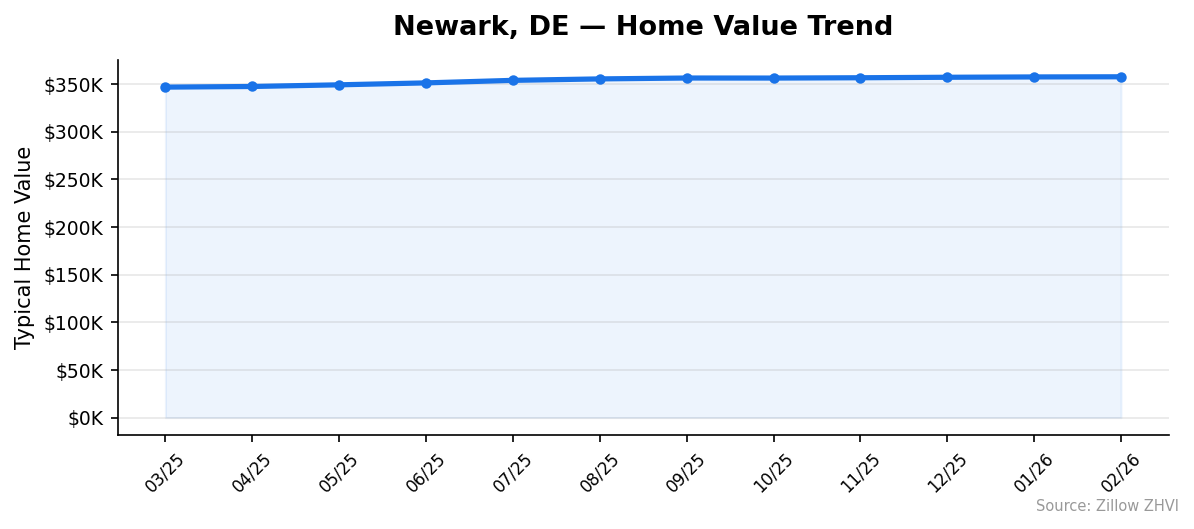
One thing to note: the monthly data shows acceleration. From March to September 2025, prices crept up slowly. Starting in October, the pace picked up. The February reading of $357,387 is the highest on record in the dataset.
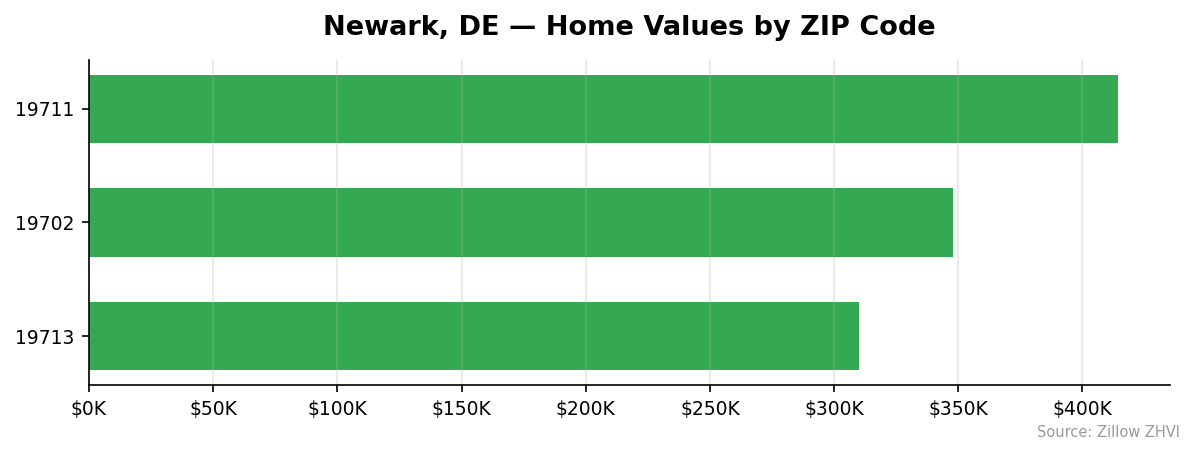
Newark Home Prices by Neighborhood
| ZIP Code | Median Home Price | Avg. Monthly Rent |
|---|---|---|
| 19711 | $414,485 | $2,220 |
| 19702 | $347,721 | $2,069 |
| 19713 | $309,956 | $1,879 |
Most Expensive
19711 tops the list at $414,485 — about 16% above the city average. This is also the ZIP with the highest rent at $2,220/month, suggesting strong demand from both buyers and renters.
Most Affordable
19713 comes in at $309,956, roughly 13% below the city average. Rent here is also the lowest at $1,879/month, making it the most budget-friendly option on both sides of the rent-vs-buy equation.
The middle ground is 19702 at $347,721. It tracks close to the citywide median and carries a moderate rent of $2,069/month. If you’re looking for something between the extremes, this ZIP splits the difference.
Rent vs Buy in Newark
Here’s what renting looks like across all three ZIP codes:
| ZIP Code | Avg. Monthly Rent | Home Price | Price-to-Rent Ratio |
|---|---|---|---|
| 19711 | $2,220 | $414,485 | 186x |
| 19702 | $2,069 | $347,721 | 168x |
| 19713 | $1,879 | $309,956 | 165x |
The citywide average rent is about $2,056/month. A rough mortgage estimate on a $357K home at 6.5% with 20% down comes to around $1,807/month in principal and interest alone. Add property taxes and insurance, and you’re likely paying $2,100 to $2,350 monthly.
That puts buying and renting in roughly the same ballpark — which is unusual. In many markets, buying is significantly more expensive on a monthly basis.
The price-to-rent ratios range from 165x to 186x across the three ZIPs. Generally, ratios below 200x lean toward buying as the better financial move over time. All three neighborhoods fall well under that threshold.
If you plan to stay in Newark for five or more years, buying has a stronger case — especially with prices rising 3.1% annually. If you need flexibility, renting at $1,879 in 19713 keeps your costs low.
Population Growth and Migration
Newark’s population has been essentially flat over the past four years.
| Year | Population |
|---|---|
| 2020 | 30,598 |
| 2021 | 29,876 |
| 2022 | 30,176 |
| 2023 | 30,315 |
| 2024 | 30,506 |
The city dropped to 29,876 in 2021 — a dip that likely reflects pandemic-era disruption in a college town — then recovered steadily. By 2024, the population reached 30,506, just 92 residents short of its 2020 level. The overall four-year change is -0.3%.
Compare that to nearby Wilmington:
| City | 2024 Population | 4-Year Growth |
|---|---|---|
| Newark | 30,506 | -0.3% |
| Wilmington | 73,176 | +3.3% |
Wilmington is growing more than 10x faster in percentage terms. That doesn’t mean Newark is declining — the numbers show stabilization after a one-year dip. But it does mean housing demand in Newark isn’t being driven by population growth. Price increases here are more likely tied to low inventory and regional spillover from the broader Philly metro.
Newark Housing Market Trends
Here’s the 12-month price trajectory:
| Month | Avg. Home Price | Min ZIP | Max ZIP |
|---|---|---|---|
| Feb 2026 | $357,387 | $309,956 | $414,485 |
| Jan 2026 | $357,229 | $310,304 | $413,862 |
| Dec 2025 | $356,883 | $310,566 | $413,220 |
| Nov 2025 | $356,383 | $310,178 | $412,591 |
| Oct 2025 | $356,054 | $309,503 | $412,168 |
| Sep 2025 | $356,095 | $309,298 | $412,016 |
| Aug 2025 | $355,172 | $308,403 | $410,609 |
| Jul 2025 | $353,647 | $307,105 | $408,480 |
| Jun 2025 | $350,996 | $304,530 | $405,562 |
| May 2025 | $348,963 | $302,079 | $403,980 |
| Apr 2025 | $347,221 | $299,869 | $402,887 |
| Mar 2025 | $346,553 | $298,870 | $402,585 |
Twelve straight months of gains. Not a single dip. The total increase from March 2025 to February 2026 was $10,834, or about 3.1%.
The climb was not uniform. From March to June 2025, prices rose about $1,500/month. From October 2025 through February 2026, gains slowed to roughly $300-$500/month. The market is still rising, but momentum has tapered.
The most expensive ZIP (19711) rose from $402,585 to $414,485 over the year — a gain of $11,900. The cheapest ZIP (19713) went from $298,870 to $309,956, gaining $11,086. Both ends of the market moved at similar rates.
Is Newark a Good Place to Buy in 2026?
The numbers favor buyers who are ready to commit. Prices are rising but not surging — 3.1% annually is close to historical norms. Monthly rent and mortgage costs are nearly equal, so you’re not paying a huge premium to build equity.
The flat population means you’re unlikely to face a sudden demand spike. That gives you more negotiating room than you’d have in a fast-growing city.
The risk? Newark is a college town with a relatively small housing stock. Three ZIP codes is not a lot of inventory. If the University of Delaware expands or a major employer moves in, prices could jump quickly.
For a first-time buyer with a budget around $310K-$350K, ZIPs 19713 and 19702 offer entry points below the city average. If you can stretch to $415K, ZIP 19711 gets you into the priciest — and highest-rent — part of town, which suggests strong long-term demand.
Newark Housing Market Outlook for 2026-2027
The 12-month trend shows clear upward movement, but the pace is slowing. Monthly gains dropped from $1,500+ in spring 2025 to under $500 by early 2026.
If the current pace continues, you can expect prices to land somewhere in the $360K-$365K range by late 2026. That’s not a boom — it’s steady, low-single-digit appreciation.
The three-month trend from December 2025 to February 2026 shows gains of about $250/month. That slower pace suggests the market is leveling off rather than accelerating.
No data here points to a price decline. Twelve consecutive months of gains with a flat population means the market is supply-constrained, not demand-driven. Barring a major economic shift in the Philly metro, Newark prices should hold or grow modestly through 2027.
Similar Markets in DE
If you’re looking at Newark, you may also want to compare prices in other Delaware cities:
- Wilmington — With a population of 73,176 and 3.3% growth, Wilmington offers a larger market with more inventory and potentially different price points than Newark’s $357K median.
Frequently Asked Questions
What is the average home price in Newark?
The average home price in Newark, DE is $357,387 as of February 2026. Prices across the city’s three tracked ZIP codes range from $309,956 in the 19713 area to $414,485 in 19711. That’s a spread of about $104,500 depending on where you buy.
Are home prices going up or down in Newark?
Prices are going up. Newark home values rose 3.1% year over year, climbing from $346,553 in March 2025 to $357,387 in February 2026. The market has posted gains every single month during that period.
Is it cheaper to rent or buy in Newark?
It’s close. The average rent across Newark is about $2,056/month. A mortgage on the median-priced home at 6.5% with 20% down runs approximately $1,807/month before taxes and insurance. Once you factor those in, monthly costs are roughly even — but buying builds equity.
What is the most affordable neighborhood in Newark?
ZIP code 19713 has the lowest median home price at $309,956, which is about $47,000 below the city average. Rent there is also the cheapest at $1,879/month, making it the best option if you’re watching your budget.
Methodology
Home values are based on the Zillow Home Value Index (ZHVI), a smoothed measure of typical home values in the 35th to 65th percentile range. Rent estimates use the Zillow Observed Rent Index (ZORI). Population figures come from the U.S. Census Bureau Population Estimates Program (2020-2024 vintage). All datasets are publicly available. Housing data updated 2026-02-28.