Columbus Home Prices: $262K, Down 1.2% — 21 ZIPs Analyzed (2026)
$261,552. That’s what a typical home costs in Columbus right now — and it’s actually less than it was a year ago. The city’s median home value slipped 1.2% over the past 12 months, a modest pullback after years of steady gains. With 21 ZIP codes ranging from under $135K to over $413K, the spread across neighborhoods tells a bigger story than the citywide number.
Quick answer: The average home price in Columbus, OH is $261,552 as of February 2026, down 1.2% year over year according to Zillow.
Current Home Prices in Columbus
Here’s where Columbus stands as of February 2026:
| Metric | Value |
|---|---|
| Median Home Value | $261,552 |
| Year-over-Year Change | -1.2% |
| Lowest ZIP Code Value | $134,792 |
| Highest ZIP Code Value | $413,961 |
| Number of ZIPs Tracked | 21 |
The 1.2% decline doesn’t look dramatic on paper, but it marks a shift. A year ago Columbus homes were still appreciating. Now the market has turned slightly negative.
The gap between the cheapest and most expensive ZIP codes is $279,169. That’s a 3-to-1 ratio — meaning you could buy three homes in the most affordable neighborhood for the price of one in the priciest. For a mid-size Midwestern city, that’s a wide spread.
Columbus remains well below the national median. Buyers relocating from coastal markets will find their dollar stretches considerably further here.
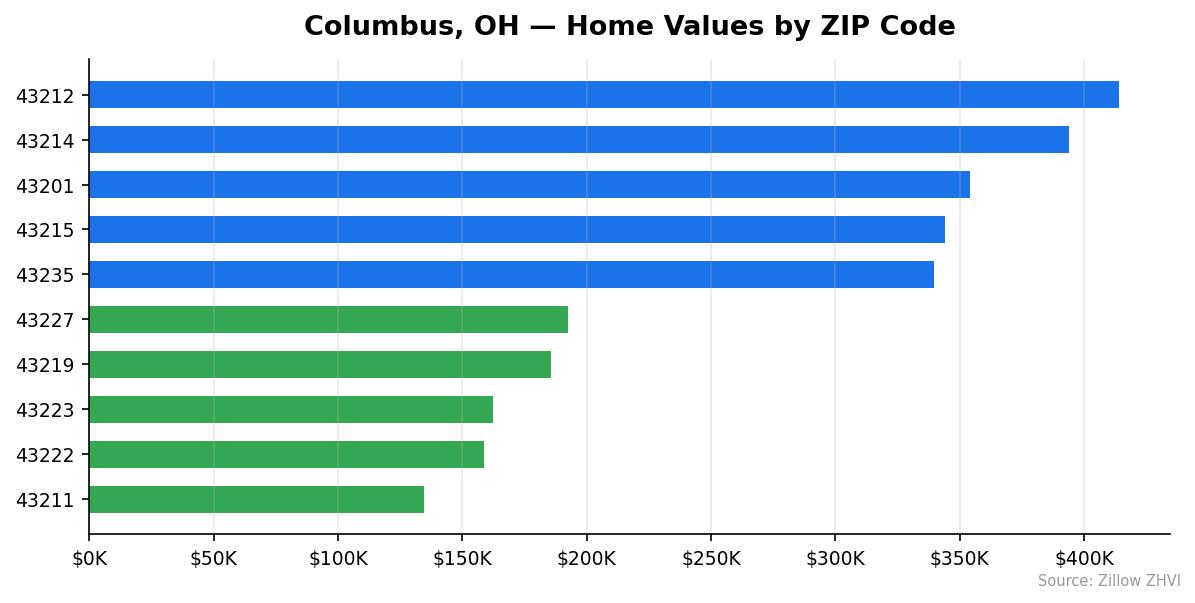
Columbus Home Prices by Neighborhood
All 21 tracked ZIP codes in Columbus, sorted from most to least expensive:
| ZIP Code | Typical Home Value | Typical Monthly Rent |
|---|---|---|
| 43212 | $413,961 | $1,566 |
| 43214 | $393,950 | $1,627 |
| 43201 | $353,956 | $1,547 |
| 43215 | $344,121 | $1,506 |
| 43235 | $339,612 | $1,376 |
| 43240 | $330,064 | $1,493 |
| 43110 | $326,622 | $1,737 |
| 43202 | $313,800 | $1,403 |
| 43205 | $271,720 | $1,525 |
| 43229 | $269,556 | $1,396 |
| 43206 | $266,896 | $1,669 |
| 43203 | $226,110 | $1,228 |
| 43232 | $214,760 | $1,471 |
| 43207 | $201,107 | $1,295 |
| 43204 | $197,072 | $1,326 |
| 43224 | $195,361 | $1,144 |
| 43227 | $192,466 | $1,501 |
| 43219 | $185,509 | $1,234 |
| 43223 | $162,369 | $1,508 |
| 43222 | $158,778 | Data not available |
| 43211 | $134,792 | $1,275 |
Most Expensive ZIP Codes
43212 — $413,961. The priciest ZIP in Columbus commands a 58% premium over the city median, yet rents here are only $1,566 per month — a relatively modest rent-to-price ratio that suggests strong owner-occupant demand.
43214 — $393,950. Just behind at nearly $394K, this ZIP also carries the second-highest rent at $1,627, reflecting desirable housing stock and location.
43201 — $353,956. At $354K with $1,547 in rent, this area sits 35% above the citywide median and rounds out the top tier.
Most Affordable ZIP Codes
43211 — $134,792. The most affordable neighborhood in Columbus by a wide margin. Homes here cost roughly half the city median. Rent runs $1,275 — one of the lower figures in the city.
43222 — $158,778. At 39% below the city median, this ZIP offers entry-level pricing. Rent data is not yet available for this area.
43223 — $162,369. Typical homes here cost $162K, but rents are surprisingly high at $1,508 — nearly matching rents in neighborhoods where homes cost twice as much.
Rent vs Buy in Columbus
The rent-versus-buy math in Columbus depends heavily on which ZIP code you’re looking at.
| Scenario | Monthly Cost |
|---|---|
| Median Rent (across ZIPs) | ~$1,480 |
| Mortgage Payment (median home, 20% down, 7%) | ~$1,392 |
| Estimated Total Ownership Cost (taxes, insurance) | ~$1,750 |
On a pure mortgage-payment basis, buying looks cheaper than renting at the citywide level. A 20% down payment on a $261,552 home puts your loan at about $209,242. At 7% over 30 years, that’s roughly $1,392 per month in principal and interest.
But once you add property taxes, insurance, and maintenance, the true cost of ownership climbs closer to $1,750. That makes renting the cheaper option month-to-month for the median household.
The calculation flips in more affordable ZIPs. In 43211, where homes run $134,792, a mortgage payment would be around $718 — far below the $1,275 typical rent in that same ZIP. In the priciest ZIPs like 43212, the mortgage on a $414K home runs about $2,203 before taxes, making renting at $1,566 significantly cheaper.
One standout: ZIP 43110 has the highest rent in the city at $1,737, but home values of $327K are below the top tier. Buying may make more sense there than in most other neighborhoods.
Population Growth and Migration
Columbus is one of Ohio’s few cities that is actually gaining residents.
| Year | Population |
|---|---|
| 2020 | 906,466 |
| 2021 | 902,862 |
| 2022 | 911,227 |
| 2023 | 920,569 |
| 2024 | 933,263 |
The city added 26,797 people between 2020 and 2024 — a 3.0% increase. After a small dip in 2021, growth accelerated each year. The 2023-to-2024 jump of 12,694 residents was the largest single-year gain in this period.
How does Columbus compare to other Ohio cities?
| City | 2024 Population | 4-Year Growth |
|---|---|---|
| Columbus | 933,263 | +3.0% |
| Cincinnati | 314,915 | +1.7% |
| Lorain | 65,751 | +0.8% |
| Hamilton | 63,953 | +0.8% |
| Akron | 189,664 | -0.3% |
| Dayton | 136,346 | -0.9% |
Columbus is growing faster than every other tracked city in Ohio. Akron and Dayton are losing people. This population growth puts upward pressure on housing demand — which makes the 1.2% price decline all the more notable. Supply may finally be catching up.
Columbus Housing Market Trends
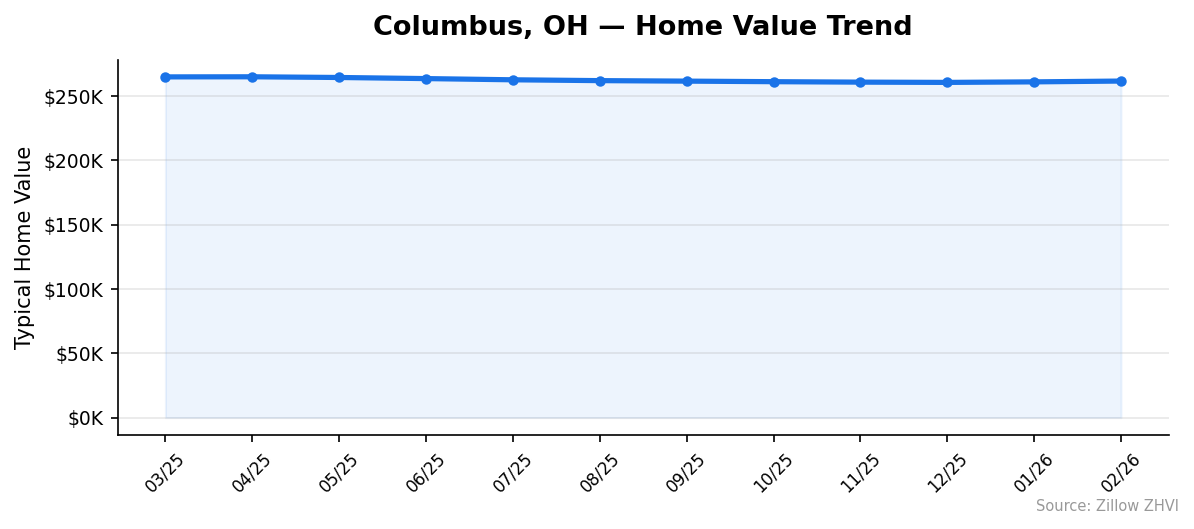
Here’s how the citywide median home value moved over the past 12 months:
| Month | Median Value | Change from Prior Month |
|---|---|---|
| Feb 2026 | $261,552 | +$623 |
| Jan 2026 | $260,929 | +$419 |
| Dec 2025 | $260,510 | -$208 |
| Nov 2025 | $260,718 | -$353 |
| Oct 2025 | $261,071 | -$426 |
| Sep 2025 | $261,497 | -$391 |
| Aug 2025 | $261,888 | -$646 |
| Jul 2025 | $262,534 | -$935 |
| Jun 2025 | $263,469 | -$862 |
| May 2025 | $264,331 | -$542 |
| Apr 2025 | $264,873 | +$81 |
| Mar 2025 | $264,792 | — |
The pattern is clear. Prices peaked around April–May 2025 near $265K, then declined steadily through the summer and fall. The market bottomed in December 2025 at $260,510 and has ticked up slightly in January and February 2026.
That’s a peak-to-trough drop of about $4,300 — roughly 1.6%. Not a crash. More of a slow deflation followed by what looks like early stabilization.
The monthly gains in January (+$419) and February (+$623) are small but consecutive. If this holds, Columbus may have found its floor.
Is Columbus a Good Place to Buy in 2026?
The numbers point toward a buyer-friendly market — at least compared to the last few years.
Prices are down 1.2% year over year. The steep monthly declines from mid-2025 have stopped. Population is growing at 3.0% over four years. And the price spread across ZIP codes means you can find homes from $135K to $414K depending on where you’re willing to live.
For first-time buyers, Columbus still offers entry points that many comparably sized cities don’t. A home in 43211 or 43222 costs less than $160K. Even the citywide median of $262K is manageable with moderate income.
The risk? Prices haven’t convincingly turned upward yet. Two months of small gains after eight months of decline is too soon to call a recovery. If you’re buying to live in the home for five-plus years, the current dip represents reasonable timing. If you’re speculating on short-term appreciation, the data doesn’t support that bet.
Columbus Housing Market Outlook for 2026-2027
The 3-month trend suggests Columbus prices are stabilizing. After dropping from $264,873 in April 2025 to $260,510 in December, the last two months posted small gains, bringing the median back to $261,552.
If the current pace of roughly $400–$600 per month continues, Columbus could reach $265K again by late summer 2026 — essentially flat compared to a year earlier.
The population growth rate of 3.0% over four years supports sustained housing demand. But the year-over-year price decline tells you demand alone isn’t enough to push prices higher right now. Inventory and mortgage rates matter too.
The most likely scenario for the next 6–12 months: flat to slightly positive price growth. A return to the rapid appreciation of prior years looks unlikely based on the current trajectory.
Similar Markets in OH
If you’re considering Columbus, these other Ohio markets are worth comparing:
- Cincinnati — Ohio’s second-largest city with 1.7% population growth. A smaller city with different price dynamics.
- Cleveland — A major metro that offers a different cost structure than Columbus.
- Dayton — Losing population at -0.9%, which may mean lower prices but weaker long-term demand.
- Toledo — A smaller Ohio market for buyers seeking even more affordability.
- Hamilton — A smaller city with 0.8% growth, worth a look for buyers priced out of Columbus.
Frequently Asked Questions
What is the average home price in Columbus?
The average home price in Columbus is $261,552 as of February 2026. Across the city’s 21 tracked ZIP codes, prices range from $134,792 in 43211 to $413,961 in 43212.
Are home prices going up or down in Columbus?
Prices are down 1.2% compared to a year ago. However, the monthly trend shows prices ticking up slightly in January and February 2026 after declining through most of 2025. The market appears to be stabilizing rather than falling further.
Is it cheaper to rent or buy in Columbus?
It depends on the neighborhood. At the city level, median rent is about $1,480 per month. A mortgage on the median home runs about $1,392 in principal and interest, but total ownership costs push closer to $1,750. In cheaper ZIPs like 43211, buying is significantly less expensive than renting.
What is the most affordable neighborhood in Columbus?
ZIP code 43211 has the lowest typical home value at $134,792 — about 48% below the city median. Monthly rent in that ZIP runs $1,275.
Methodology
Home values are based on the Zillow Home Value Index (ZHVI), a smoothed measure of typical home values in the 35th to 65th percentile range. Rent estimates use the Zillow Observed Rent Index (ZORI). Population figures come from the U.S. Census Bureau Population Estimates Program (2020-2024 vintage). All datasets are publicly available. Housing data updated 2026-02-28.