Arlington Home Prices: $804K, Up 0.5% — 10 ZIPs Analyzed (2026)
$803,585. That’s what a typical home costs in Arlington, VA right now — and prices are still creeping up.
Quick answer: The average home price in Arlington, VA is $803,585 as of February 2026, up 0.5% year over year according to Zillow.
Current Home Prices in Arlington
Arlington sits in the Washington-Arlington-Alexandria metro area, and its housing market reflects that proximity to the nation’s capital. Here’s the snapshot:
| Metric | Value |
|---|---|
| Median Home Price | $803,585 |
| Year-over-Year Change | +0.5% |
| Lowest ZIP Median | $436,048 |
| Highest ZIP Median | $1,357,464 |
| Number of ZIPs Tracked | 10 |
| Data as of | February 2026 |
A 0.5% annual gain might not sound like much. But on an $804K home, that’s roughly $4,000 in equity over 12 months — without lifting a finger.
The price spread tells the real story. The gap between the cheapest and most expensive ZIP is over $921,000. Where you buy within Arlington matters more than when.
That range also means Arlington isn’t exclusively an $800K market. There are entry points below $450K if you know where to look.
Arlington Home Prices by Neighborhood
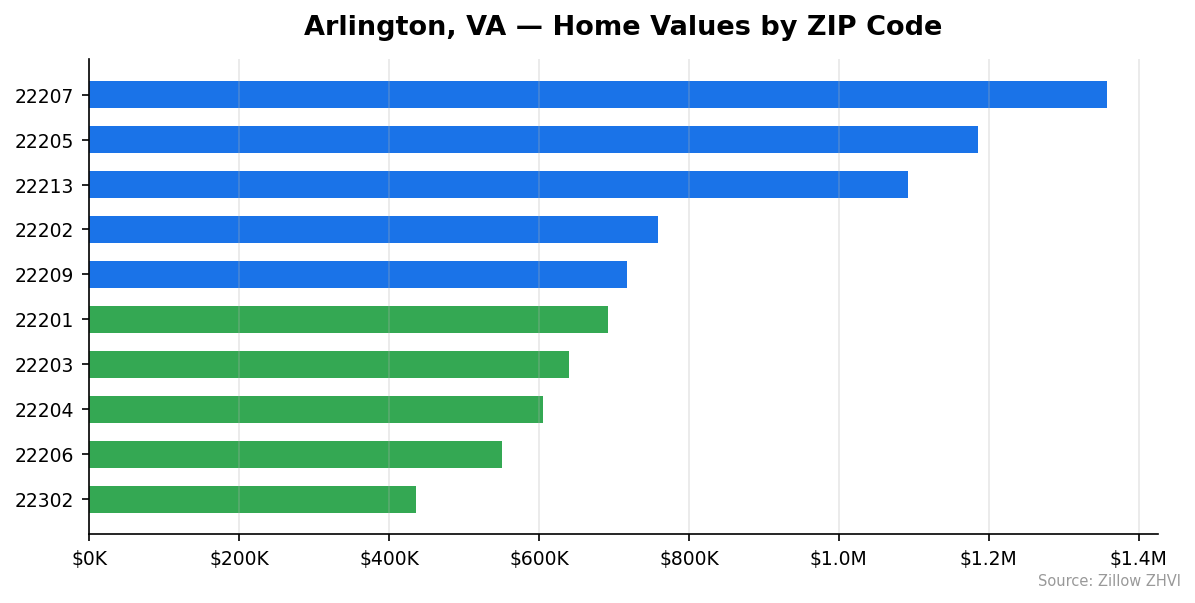
All 10 tracked ZIP codes, ranked from most to least expensive:
| ZIP Code | Median Home Value | Avg. Monthly Rent |
|---|---|---|
| 22207 | $1,357,464 | $3,214 |
| 22205 | $1,186,123 | $3,125 |
| 22213 | $1,091,870 | N/A |
| 22202 | $758,737 | $2,646 |
| 22209 | $718,127 | $2,753 |
| 22201 | $692,129 | $2,686 |
| 22203 | $640,150 | $2,825 |
| 22204 | $604,869 | $2,171 |
| 22206 | $550,336 | $2,342 |
| 22302 | $436,048 | $2,265 |
Most Expensive ZIPs
22207 leads at $1,357,464 — nearly 69% above the city median, with rents to match at $3,214 per month. 22205 follows at $1,186,123, about 48% above average, with rents of $3,125. 22213 rounds out the top three at $1,091,870, though rent data isn’t available for this area.
Most Affordable ZIPs
22302 is the clear budget pick at $436,048 — almost 46% below the city median — with the lowest rents in Arlington at $2,265. 22206 comes in at $550,336 with rents of $2,342. 22204 offers the lowest rents citywide at $2,171 on a home value of $604,869.
Rent vs Buy in Arlington
Renting is the cheaper monthly option in Arlington. Here’s the math.
The city-wide average rent across 9 ZIPs with data comes to approximately $2,781 per month. Now compare that to buying.
On the median home price of $803,585, a conventional mortgage at 6.5% with 20% down ($642,868 loan) runs about $4,063 in principal and interest alone. Add property taxes and insurance and you’re looking at roughly $4,800 per month.
| Monthly Cost | |
|---|---|
| Average Rent | ~$2,781 |
| Estimated Mortgage (P&I) | ~$4,063 |
| Estimated Total Housing (buy) | ~$4,800 |
| Monthly Difference | ~$2,019 |
That’s a $2,019 gap every month. Over a year, renters save roughly $24,000 compared to buyers on monthly costs.
Of course, buying builds equity. That 0.5% appreciation on $803,585 adds about $4,000 per year in home value. But the monthly cash flow math still favors renters by a wide margin — especially in the higher-priced ZIPs where rent-to-price ratios are more favorable for tenants.
The cheapest route: rent in 22204 at $2,171 and invest the difference.
Arlington Housing Market Trends
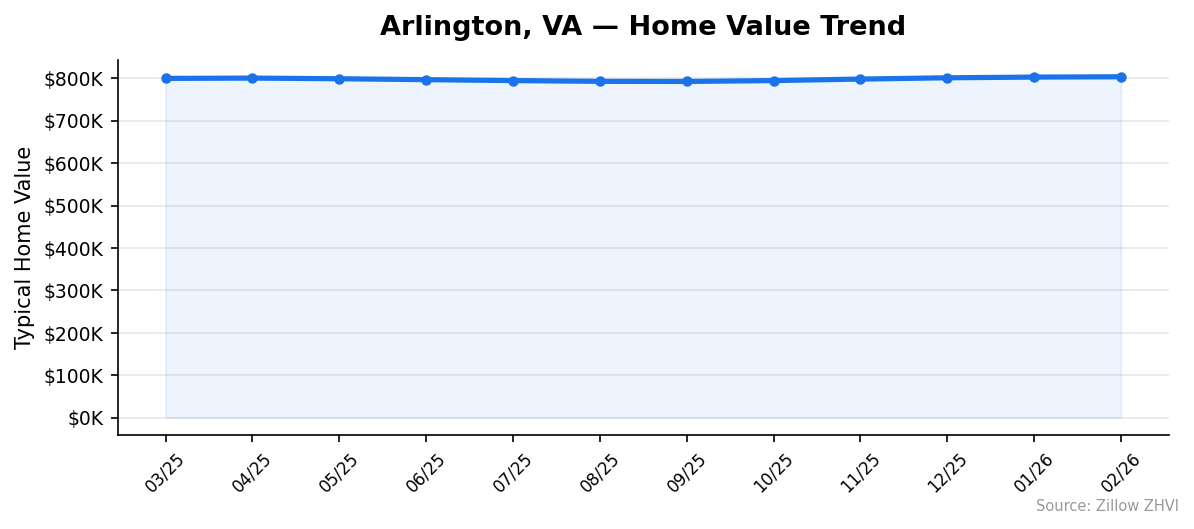
Here’s how prices moved over the past 12 months:
| Month | Avg. Home Value | Min | Max |
|---|---|---|---|
| Feb 2026 | $803,585 | $436,048 | $1,357,464 |
| Jan 2026 | $802,870 | $435,701 | $1,354,998 |
| Dec 2025 | $801,219 | $434,983 | $1,351,033 |
| Nov 2025 | $798,219 | $434,248 | $1,345,313 |
| Oct 2025 | $794,653 | $433,006 | $1,340,209 |
| Sep 2025 | $792,605 | $432,010 | $1,338,918 |
| Aug 2025 | $792,839 | $430,842 | $1,342,761 |
| Jul 2025 | $794,654 | $430,463 | $1,349,266 |
| Jun 2025 | $796,818 | $430,932 | $1,354,608 |
| May 2025 | $798,996 | $432,713 | $1,358,131 |
| Apr 2025 | $800,494 | $434,803 | $1,358,348 |
| Mar 2025 | $799,799 | $435,752 | $1,354,777 |
The pattern is clear: prices dipped from spring 2025 through September, hitting a floor around $792,600, then reversed course. From September to February, values rose $10,980 — a 1.4% gain in five months.
The floor values in lower-priced ZIPs bottomed out in July 2025 at $430,463 and have since recovered to $436,048.
Meanwhile, the ceiling in premium ZIPs peaked in May 2025 at $1,358,348, dipped through September, and is now climbing back toward that high at $1,357,464.
Is Arlington a Good Place to Buy in 2026?
The numbers point to a stable market with a slight upward tilt.
A 0.5% annual gain isn’t going to make you rich. But it’s not losing value either. For buyers, that means less urgency — you’re not chasing a runaway market. For sellers, there’s no fire sale happening.
The real question is which ZIP you target. Buying in 22302 at $436K puts you well below the city average with rent savings if you move later. At the other end, 22207 at $1.36M is a bet on Arlington’s premium corridor holding value.
One thing working in buyers’ favor: price growth has been flat enough that you have time. The five-month recovery since September added about $2,200 per month to the median. That’s meaningful but not panic-inducing.
If you can handle the monthly payments, Arlington’s position next to D.C. provides a floor under demand. Federal employment and government contracting aren’t going anywhere.
Arlington Housing Market Outlook for 2026-2027
The 5-month upward trend from September 2025 through February 2026 shows steady momentum — roughly $2,200 per month in gains. If that pace continues, the median could cross $815,000 by mid-2026.
But look at the full year. Prices were essentially flat from March 2025 ($799,799) to February 2026 ($803,585). That’s only $3,786 over 12 months. The mid-year dip and subsequent recovery suggest a seasonal pattern more than a true breakout.
The 3-month trend from December to February shows gains of about $1,200 per month — slower than the fall rebound. This deceleration suggests the recovery may be settling into a steadier, more modest pace.
Expect Arlington to remain in the $800K to $815K range through late 2026, barring any major shifts in mortgage rates or federal employment.
Similar Markets in VA
If you’re considering Arlington, these Virginia markets are worth comparing:
- Fairfax — Another Northern Virginia suburb with similar proximity to D.C. and government-sector demand.
- Woodbridge — Further south along the I-95 corridor, typically offering lower price points than Arlington.
- Fredericksburg — A commuter option for those willing to trade a longer drive for more house.
- Chesapeake — In the Hampton Roads region, a different market entirely with prices well below Northern Virginia.
- Virginia Beach — Coastal living at a fraction of Arlington’s cost, though without Metro access.
Frequently Asked Questions
What is the average home price in Arlington?
The average home price in Arlington, VA is $803,585 as of February 2026. Prices range widely from $436,048 in the 22302 ZIP code to $1,357,464 in 22207. Your budget determines your neighborhood more than your timing.
Are home prices going up or down in Arlington?
Prices are up 0.5% year over year. After dipping to about $792,605 in September 2025, the market has recovered with five consecutive months of gains. The trend is upward but slow — this isn’t a boom market.
Is it cheaper to rent or buy in Arlington?
Renting is significantly cheaper on a monthly basis. Average rent across Arlington runs about $2,781 per month, while buying the median-priced home costs roughly $4,800 per month including taxes and insurance. That’s a $2,019 monthly gap favoring renters.
What is the most affordable neighborhood in Arlington?
ZIP code 22302 has the lowest median home value at $436,048 — almost half the city-wide median. Rent there averages $2,265 per month, also the second-lowest in the city. ZIP 22206 at $550,336 is the next most affordable option.
Methodology
Home values are based on the Zillow Home Value Index (ZHVI), a smoothed measure of typical home values in the 35th to 65th percentile range. Rent estimates use the Zillow Observed Rent Index (ZORI). Population figures come from the U.S. Census Bureau Population Estimates Program (2020-2024 vintage). All datasets are publicly available. Housing data updated 2026-02-28.