Oklahoma City Home Prices: $240K, Up 0.3% — 36 ZIPs Analyzed (2026)
$240,071. That is the typical home value in Oklahoma City right now, up just 0.3% from a year ago. Across 36 ZIP codes the market has gone almost nowhere for 12 months, with prices ranging from $92,973 in the cheapest neighborhood to $629,062 in the priciest.
Quick answer: The average home price in Oklahoma City, OK is $240,071 as of February 2026, up 0.3% year over year according to Zillow.
Current Home Prices in Oklahoma City
The Oklahoma City market is one of the flatter ones in the country right now. Prices barely moved in either direction over the past year, and the spread between the cheapest and most expensive ZIPs is wide enough that two buyers shopping at the same time can have radically different experiences.
| Metric | Value |
|---|---|
| Median home value | $240,071 |
| Year-over-year change | +0.3% |
| Cheapest ZIP value | $92,973 |
| Most expensive ZIP value | $629,062 |
| ZIP codes analyzed | 36 |
| Data through | February 2026 |
A buyer with a $240K budget can find a typical home in mid-tier ZIPs like 73120 ($238,532) or 73118 ($230,951). At the bottom end, three ZIPs sit under $110K — territory where investor activity tends to dominate. At the top, 73151 nearly hits $629K, which is more than 6.7 times the value in the cheapest ZIP.
The 0.3% annual gain is essentially a hold. After adjusting for inflation, real values fell. That matters if you are buying with the expectation of appreciation, because Oklahoma City is not running with the national pack on price growth.
What the data does not show: condition, lot size, or school assignment. Two homes at the median can look very different in person, and the ZHVI averages across all of them.
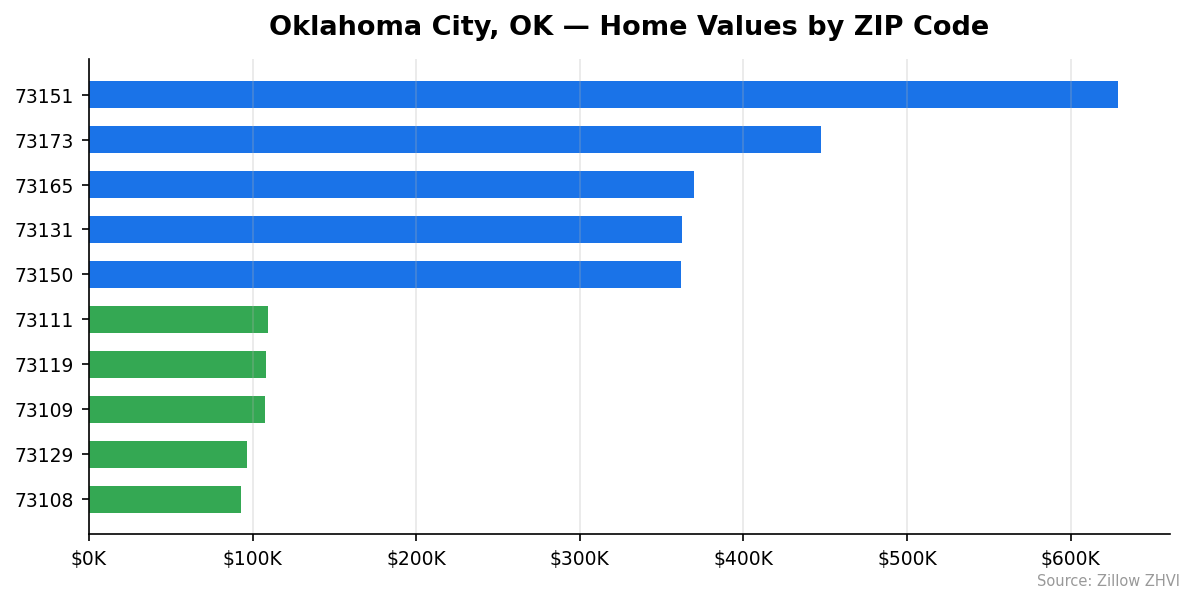
Oklahoma City Home Prices by Neighborhood
You can sort the 36 ZIPs into roughly four tiers: under $125K, $125K–$200K, $200K–$300K, and above $300K. Most of the city falls in the middle two.
| ZIP | Home Value | Typical Rent |
|---|---|---|
| 73151 | $629,062 | — |
| 73173 | $447,183 | — |
| 73165 | $369,964 | — |
| 73131 | $362,462 | — |
| 73150 | $361,808 | — |
| 73142 | $356,927 | $1,342 |
| 73104 | $354,354 | $1,455 |
| 73169 | $346,822 | — |
| 73103 | $341,041 | $1,159 |
| 73116 | $318,156 | $1,655 |
| 73102 | $296,738 | $1,352 |
| 73170 | $284,462 | $1,392 |
| 73179 | $276,537 | — |
| 73162 | $266,560 | $1,737 |
| 73128 | $260,858 | $1,228 |
| 73120 | $238,532 | $1,220 |
| 73132 | $232,703 | $1,084 |
| 73118 | $230,951 | $1,372 |
| 73135 | $204,936 | $1,311 |
| 73134 | $199,581 | $1,272 |
| 73127 | $187,024 | $1,258 |
| 73139 | $186,288 | $943 |
| 73106 | $184,505 | $1,201 |
| 73112 | $183,200 | $1,265 |
| 73159 | $174,096 | $1,357 |
| 73114 | $156,246 | $1,351 |
| 73107 | $152,600 | $1,186 |
| 73105 | $151,520 | $1,254 |
| 73084 | $140,503 | — |
| 73149 | $118,103 | $1,242 |
| 73117 | $114,640 | $1,200 |
| 73111 | $109,310 | $1,160 |
| 73119 | $108,269 | $1,072 |
| 73109 | $107,282 | $932 |
| 73129 | $96,359 | $1,135 |
| 73108 | $92,973 | $1,024 |
Most Expensive
73151 leads the city at $629,062, more than 2.6 times the citywide median. 73173 follows at $447,183, sitting at the southern edge of the metro. 73165 rounds out the top three at $369,964, still about 54% above the city average.
Most Affordable
73108 is the cheapest ZIP at $92,973, with rents around $1,024 — meaning rent-to-price ratios that get investors interested. 73129 at $96,359 is the second-cheapest, and rents there ($1,135) are higher relative to home values. 73109 sits at $107,282 with the lowest rent in the dataset at $932 per month.
Rent vs Buy in Oklahoma City
Rents across Oklahoma City run from $932 a month in 73109 to $1,737 in 73162, with most ZIPs falling between $1,100 and $1,400. The citywide picture sits well below typical mortgage payments.
Run the numbers on a $240,071 home. With 20% down ($48,014), a 30-year fixed at 7%, the principal and interest alone come to about $1,277 a month. Add property tax (Oklahoma County effective rates land near 1%), homeowners insurance, and you are looking at roughly $1,600 to $1,750 in monthly housing cost.
| Path | Typical Monthly Cost |
|---|---|
| Rent (mid-tier ZIPs like 73120, 73127, 73128) | $1,200–$1,260 |
| Buy at median ($240K, 20% down, 7%) | ~$1,650 (PITI) |
Rent wins on monthly cash flow in most of the city. The exceptions are high-rent pockets like 73162 ($1,737) and 73116 ($1,655) where the gap narrows.
Buying makes more sense if you stay long enough to amortize closing costs and capture any appreciation. With prices up just 0.3% over the past year, that math is harder than it was three years ago. Equity has to come from principal paydown, not market gains.
A buyer who plans to stay seven-plus years and can absorb the higher monthly cost still comes out ahead in most scenarios. A two- or three-year stay almost certainly does not work right now.
Population Growth and Migration
Oklahoma City had 712,919 residents in 2024, up from 683,084 in 2020 — a 4.4% increase over four years.
| Year | Population |
|---|---|
| 2020 | 683,084 |
| 2021 | 688,596 |
| 2022 | 696,756 |
| 2023 | 704,567 |
| 2024 | 712,919 |
The city added about 7,460 residents per year on average. That is steady, not explosive, but it is growth — which puts ongoing demand under the housing market even when prices are flat.
Compared to other Oklahoma cities, the picture is mixed:
| City | 2024 Population | 4-Year Growth |
|---|---|---|
| Oklahoma City | 712,919 | +4.4% |
| Broken Arrow | 122,756 | +7.7% |
| Edmond | 99,040 | +4.5% |
| Stillwater | 50,138 | +3.6% |
| Norman | 131,010 | +2.2% |
| Moore | 63,845 | +1.2% |
Broken Arrow is growing faster on a percentage basis, but Oklahoma City is adding more total residents than the rest of the list combined. Edmond — a popular suburb on the north side — is roughly tracking the central city’s pace. Demand drivers like job formation and household creation are not flashing strong, but they are not flashing weak either.
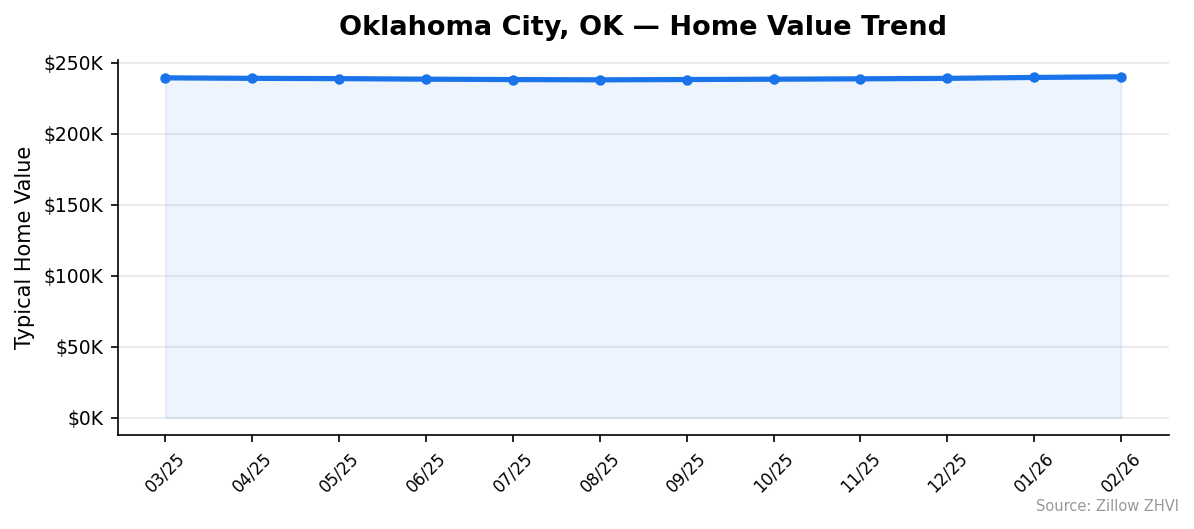
Oklahoma City Housing Market Trends
Twelve months of data tells a flat story with a slight late-year lift.
| Month | Median Value |
|---|---|
| Feb 2026 | $240,071 |
| Jan 2026 | $239,615 |
| Dec 2025 | $238,965 |
| Nov 2025 | $238,636 |
| Oct 2025 | $238,374 |
| Sep 2025 | $238,145 |
| Aug 2025 | $237,923 |
| Jul 2025 | $238,125 |
| Jun 2025 | $238,396 |
| May 2025 | $238,784 |
| Apr 2025 | $238,975 |
| Mar 2025 | $239,322 |
Prices drifted lower from March 2025 through August, hit a floor at $237,923, and have climbed five months in a row since. The total move from the August trough to February is +$2,148, or about 0.9%.
The most recent three months have been the strongest stretch in the data: November to February added $1,435 in value. That works out to roughly a 2.4% annualized pace — well above the 0.3% YoY headline.
Whether that signals a real shift or normal seasonal noise is the open question. Oklahoma City has historically run with mild winter softness and spring strength, so some of this may be calendar effects.
Is Oklahoma City a Good Place to Buy in 2026?
The 0.3% YoY change tells you this is neither a buyer’s nor a seller’s market — it is a balanced one. Sellers are not getting bidding wars. Buyers are not getting big discounts.
For first-time buyers, the appeal is the entry price. ZIPs under $150K still exist in OKC, which is rare in growing metros. Rents are lower than mortgage costs in most of the city, so the rent-vs-buy math should drive your decision more than fear of missing out on appreciation.
For move-up buyers, the flat market cuts both ways: your current home sells for about what you paid a year ago, but the trade-up house is also priced where it was. Less to lose, less to gain.
For investors, the cheap-ZIP rental yields look attractive on paper — a $108K home in 73119 renting for $1,072 produces a gross yield near 12%. Net yields will be much lower after taxes, insurance, vacancy, and repairs.
Verdict: a fine market for buyers who plan to stay, a tough one for short-term flippers.
Oklahoma City Housing Market Outlook for 2026-2027
The 3-month trend suggests modest forward momentum. Five straight months of gains and a $1,435 move from November to February point to a market that is no longer drifting down.
If the current pace continues, prices land somewhere in the $241K–$244K range by mid-2026. That is not a forecast — it is what the recent data extrapolates to if the trajectory holds.
Two things could change the picture. A drop in mortgage rates would likely push the recent acceleration further, since affordability is the main constraint here. A rate spike would probably stall the small recovery and put another flat or slightly negative print on the board.
Watch the spring 2026 data carefully. If March and April keep the +$400-to-$500 monthly cadence, the next year’s YoY headline will look meaningfully different from this one.
Similar Markets in OK
- Tulsa — the state’s other major metro, worth checking for buyers comparing OKC’s flat market to Tulsa’s trajectory.
- Norman — a college town just south of OKC with slower 2.2% population growth but a different price profile.
- Edmond — the affluent north-side suburb where buyers priced out of OKC’s premium ZIPs often land.
- Broken Arrow — Oklahoma’s fastest-growing city in this dataset at +7.7%, near Tulsa rather than OKC.
- Lawton — a smaller southwest Oklahoma market for buyers seeking lower entry prices than OKC offers.
Frequently Asked Questions
What is the average home price in Oklahoma City?
The average home price in Oklahoma City, OK is $240,071 as of February 2026. That figure spans 36 ZIP codes and ranges from $92,973 at the low end to $629,062 at the high end.
Are home prices going up or down in Oklahoma City?
Prices are up 0.3% year over year — essentially flat. The market bottomed in August 2025 at $237,923 and has gained five months in a row since, with the strongest stretch coming in the most recent three months.
Is it cheaper to rent or buy in Oklahoma City?
Renting is cheaper in most of the city. Typical rents fall between $1,100 and $1,400, while owning the median $240K home with 20% down at 7% costs roughly $1,650 a month after taxes and insurance.
What is the most affordable neighborhood in Oklahoma City?
ZIP 73108 is the most affordable at $92,973. Two other ZIPs sit below $100K — 73129 at $96,359 — with several more under $115K, making the south and northeast sides of the city the lowest-priced areas.
Methodology
Home values are based on the Zillow Home Value Index (ZHVI), a smoothed measure of typical home values in the 35th to 65th percentile range. Rent estimates use the Zillow Observed Rent Index (ZORI). Population figures come from the U.S. Census Bureau Population Estimates Program (2020-2024 vintage). All datasets are publicly available. Housing data updated 2026-02-28.