Tulsa Home Prices: $210K, Up 2.5% — 25 ZIPs Analyzed (2026)
$210,184. That’s what a typical Tulsa home costs as of February 2026. Prices are up 2.5% over the past year — modest growth in a market where the cheapest ZIP still trades under $84,000 and the priciest tops $421,000.
Quick answer: The average home price in Tulsa, OK is $210,184 as of February 2026, up 2.5% year over year according to Zillow.
Current Home Prices in Tulsa
The median home value across 25 Tulsa ZIP codes sits at $210,184. A year ago it was roughly $205,000. That’s a $5,072 gain.
The spread between ZIPs is wide. Tulsa’s cheapest neighborhood is five times less expensive than its priciest.
| Metric | Value |
|---|---|
| Median home value | $210,184 |
| Year-over-year change | +2.5% |
| Lowest ZIP value | $83,501 |
| Highest ZIP value | $421,291 |
| ZIP codes tracked | 25 |
| Data through | February 2026 |
Tulsa sits well below the U.S. median. That gap is part of why the metro has held up through a period when more expensive Sun Belt cities like Austin and Phoenix saw prices fall. Lower entry prices mean less room to correct.
The 2.5% annual gain matches the national pattern of cooling but still positive appreciation. It’s not a boom. It’s slow, steady growth — the kind that rewards patience over timing.
You should read this number as a median across 25 ZIPs, not a single list price. What you’ll actually pay depends heavily on which neighborhood you’re shopping in.
Tulsa Home Prices by Neighborhood
The table below shows every Tulsa ZIP code tracked, sorted from most to least expensive.
| ZIP Code | Home Value | Rent (ZORI) |
|---|---|---|
| 74137 | $421,291 | $1,191 |
| 74133 | $297,536 | $1,183 |
| 74132 | $292,333 | — |
| 74105 | $284,407 | $1,462 |
| 74114 | $270,337 | $1,541 |
| 74120 | $270,300 | $1,301 |
| 74131 | $269,747 | — |
| 74135 | $266,113 | $1,310 |
| 74136 | $262,833 | $890 |
| 74134 | $258,399 | $1,346 |
| 74104 | $228,516 | $1,512 |
| 74145 | $223,329 | $1,409 |
| 74116 | $191,160 | — |
| 74129 | $187,003 | $1,450 |
| 74146 | $179,976 | — |
| 74108 | $176,280 | — |
| 74112 | $173,159 | $1,245 |
| 74119 | $170,967 | $1,359 |
| 74128 | $156,139 | $1,096 |
| 74107 | $152,596 | $1,072 |
| 74127 | $129,160 | $1,113 |
| 74115 | $113,545 | $1,079 |
| 74106 | $104,343 | $1,254 |
| 74110 | $91,635 | $1,003 |
| 74126 | $83,501 | $1,239 |
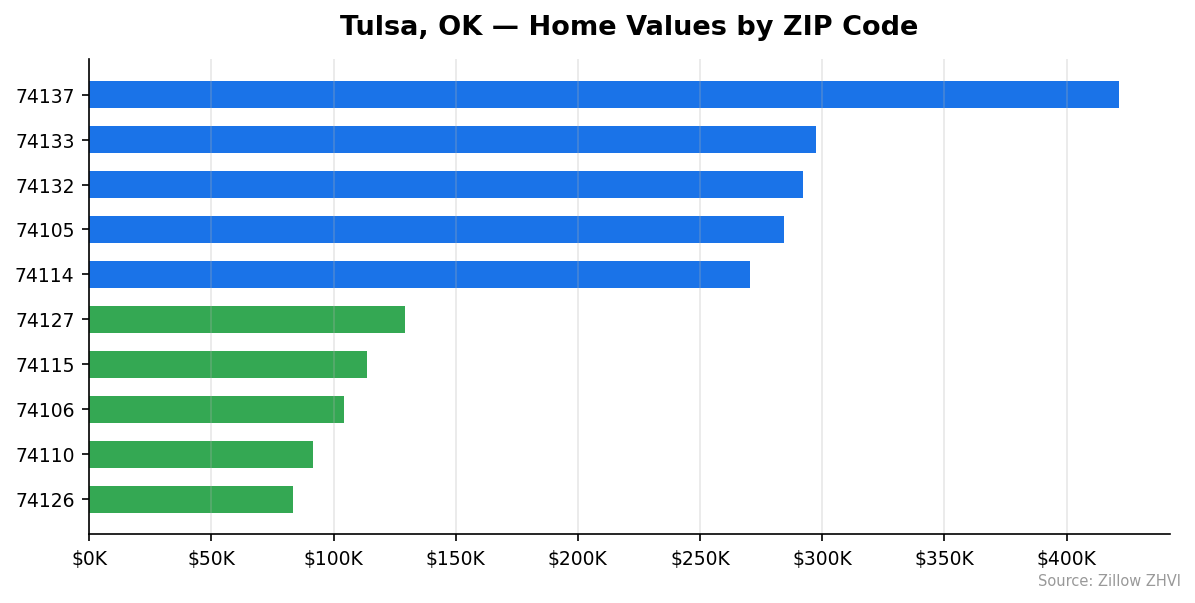
Most Expensive
- 74137 at $421,291 — more than double the citywide median, concentrated in south Tulsa’s newer subdivisions where rents also run above average at $1,191.
- 74133 at $297,536 — another south Tulsa ZIP with home values about 42% above the city median and rent near $1,183.
- 74132 at $292,333 — southwest Tulsa, roughly 39% above the median.
Most Affordable
- 74126 at $83,501 — the cheapest ZIP by a wide margin, trading at about 40% of the citywide median while rent still averages $1,239. That rent-to-value ratio is one of the strongest in the city.
- 74110 at $91,635 — also well below $100K, with rents around $1,003.
- 74106 at $104,343 — north Tulsa, with rent ($1,254) that’s higher than the area’s home prices would suggest.
Rent vs Buy in Tulsa
Average rent across Tulsa’s tracked ZIPs is about $1,253 per month. The range runs from $890 in 74136 to $1,541 in 74114.
At $210,184 with 20% down and a 7% 30-year fixed mortgage, principal and interest lands near $1,119 a month. Add property taxes and insurance — roughly $300 in this market — and your monthly housing cost is closer to $1,400.
| Scenario | Monthly Cost |
|---|---|
| Average Tulsa rent | ~$1,253 |
| Median home mortgage (P&I only) | ~$1,119 |
| Median home, all-in (taxes + insurance) | ~$1,400 |
Renting wins on cash flow. Buying pulls ahead on equity and tax treatment over time.
The most interesting split shows up at the ZIP level. In 74106, the average rent ($1,254) exceeds the monthly cost of buying a typical home there. Same story in 74110 and 74126 — cheap homes with rents close to or above the mortgage math. If you’re hunting for rent-to-own or rental property math, those north Tulsa ZIPs are where the numbers work hardest.
In premium ZIPs like 74137 and 74133, the math flips. Buying costs more per month than renting, and you need a long time horizon for it to pay off.
Population Growth and Migration
Tulsa’s population was 415,154 in 2024. That’s up 0.4% from 413,663 in 2020 — essentially flat over four years.
| Year | Population |
|---|---|
| 2020 | 413,663 |
| 2021 | 412,923 |
| 2022 | 413,062 |
| 2023 | 414,035 |
| 2024 | 415,154 |
The city lost residents in 2021, bottomed out, then added population each year since. It’s growing, just not quickly.
The suburbs are doing better. Broken Arrow jumped 7.7% over the same four years. Oklahoma metro areas like Edmond (+4.5%) and Oklahoma City (+4.4%) also outpaced Tulsa proper.
| City | 2024 Population | 4-Year Growth |
|---|---|---|
| Oklahoma City | 712,919 | +4.4% |
| Tulsa | 415,154 | +0.4% |
| Norman | 131,010 | +2.2% |
| Broken Arrow | 122,756 | +7.7% |
| Edmond | 99,040 | +4.5% |
| Stillwater | 50,138 | +3.6% |
Slow population growth caps housing demand. It also explains why Tulsa’s price appreciation is modest compared to fast-growing metros. If you’re buying here, don’t count on a migration wave to bail out an overpriced purchase.
Tulsa Housing Market Trends
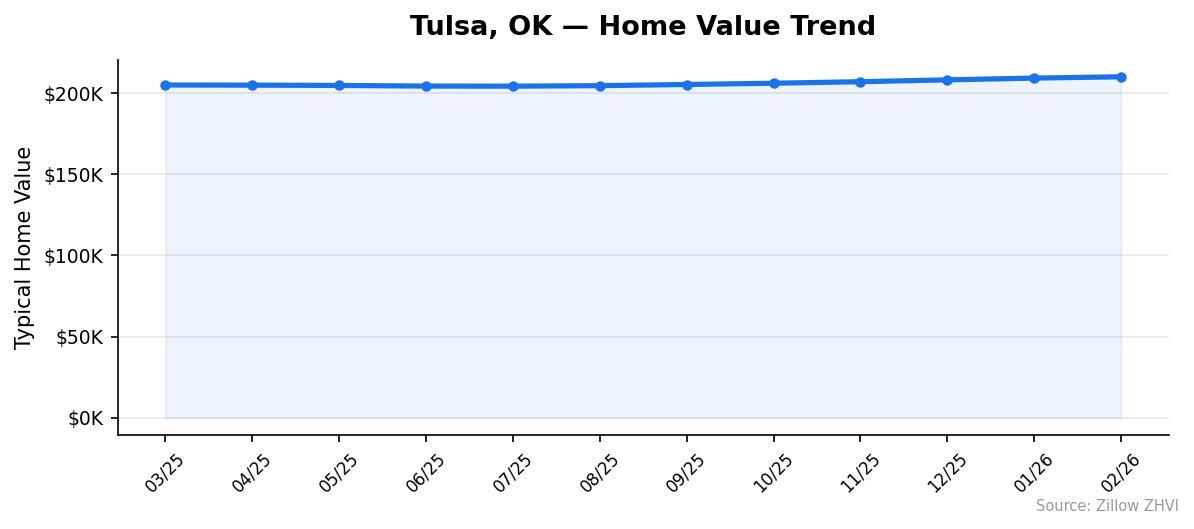
Prices bottomed in mid-2025 and have climbed every month since.
| Month | Median Value |
|---|---|
| March 2025 | $205,112 |
| June 2025 | $204,459 |
| September 2025 | $205,426 |
| December 2025 | $208,287 |
| February 2026 | $210,184 |
From the June 2025 low to February 2026, the median added $5,725 — a 2.8% gain in eight months. The last three months alone account for $1,897 of that move.
Momentum is building, not fading. That’s different from many Sun Belt markets where growth has stalled or reversed.
Is Tulsa a Good Place to Buy in 2026?
Tulsa looks like a buyer-friendly market with a seller’s tilt forming.
The case for buying is simple. Entry prices are low — you can find a house under $100K in four ZIP codes. Rents are close enough to mortgage payments that buying makes sense if you’ll stay three-plus years. Appreciation is real but slow, so you’re not bidding against speculators.
The case for waiting is thinner. Prices are rising month after month. Rates remain elevated. But there’s no sign of a correction in the data.
Pick by ZIP. A $421K house in 74137 is a different market than a $84K house in 74126. The first is a stretch buy tied to white-collar income. The second is cash-flow math — a rental where rent nearly covers the full house payment.
If you need a move-in-ready home in a top school zone, south Tulsa works. If you want yield, north Tulsa pays it.
Tulsa Housing Market Outlook for 2026-2027
The three-month trend suggests continued price gains through spring 2026. From December 2025 to February 2026, the median rose from $208,287 to $210,184 — a pace of roughly $950 per month.
If the current pace continues, Tulsa’s median crosses $213,000 by mid-2026 and approaches $216,000 by year-end. That’s an extrapolation of recent data, not a forecast of market conditions.
Risks to that path are the usual ones: mortgage rates, the broader economy, and what happens with national inventory. Tulsa moves slower than coastal markets in both directions — it didn’t spike as hard in 2021 and it hasn’t corrected like Austin or Phoenix since.
Flat population growth will likely cap how far prices can run. Expect the grind-higher pattern to continue rather than a sharp acceleration.
Similar Markets in OK
- Broken Arrow — Tulsa’s fastest-growing suburb with stronger demographics and usually higher prices.
- Oklahoma City — the state’s largest metro, with more listings and comparable price points.
- Edmond — an OKC suburb with steadier growth than Tulsa at a premium.
- Norman — a college town alternative for buyers who want a university market.
- Midwest City — another OKC-area option worth comparing to Tulsa’s mid-range ZIPs.
Frequently Asked Questions
What is the average home price in Tulsa?
The average home price in Tulsa, OK is $210,184 as of February 2026. That figure is the median of Zillow Home Value Index readings across 25 Tulsa ZIP codes, ranging from $83,501 in 74126 to $421,291 in 74137.
Are home prices going up or down in Tulsa?
Tulsa prices are up 2.5% year over year. The median climbed from roughly $205,000 in March 2025 to $210,184 in February 2026, and values have risen every month since June 2025.
Is it cheaper to rent or buy in Tulsa?
Renting is cheaper month-to-month in most of the city. Average rent is about $1,253, while a mortgage on the median $210K home runs closer to $1,400 all-in. The picture flips in cheaper north Tulsa ZIPs like 74106 and 74126, where buying costs less per month than renting.
What is the most affordable neighborhood in Tulsa?
ZIP 74126 in north Tulsa is the most affordable, with a typical home value of $83,501 — about 60% below the city median. Rent there averages $1,239, giving it one of the highest rent-to-value ratios in Tulsa.
Methodology
Home values are based on the Zillow Home Value Index (ZHVI), a smoothed measure of typical home values in the 35th to 65th percentile range. Rent estimates use the Zillow Observed Rent Index (ZORI). Population figures come from the U.S. Census Bureau Population Estimates Program (2020-2024 vintage). All datasets are publicly available. Housing data updated 2026-02-28.