Edmond Home Prices: $391K, Up 0.8% — 6 ZIPs Analyzed (2026)
Can you still afford a house in Edmond? $390,651 — that’s the typical home value as of February 2026. Prices are up 0.8% from a year ago, a modest gain that keeps Edmond firmly in slow-growth territory. Across 6 ZIP codes, prices range from under $270K to over $520K, so where you buy matters more than when.
Quick answer: The average home price in Edmond, OK is $390,651 as of February 2026, up 0.8% year over year according to Zillow.
Current Home Prices in Edmond
| Metric | Value |
|---|---|
| Median Home Value | $390,651 |
| Year-over-Year Change | +0.8% |
| Lowest ZIP Value | $269,732 |
| Highest ZIP Value | $520,413 |
| Number of ZIPs Tracked | 6 |
| Data as of | February 2026 |
A 0.8% annual increase means Edmond home values gained about $3,100 over the past year. That’s barely keeping pace with inflation. For buyers, this signals a market without much urgency — prices aren’t running away from you.
The gap between the cheapest and most expensive ZIP is $250,681. That spread tells you Edmond isn’t one market. It’s several, stitched together under one city name.
Compared to the broader Oklahoma City metro, Edmond sits at the upper end of the price spectrum. The city has long attracted families looking for strong schools and suburban space, and the price premium reflects that.
Edmond Home Prices by Neighborhood
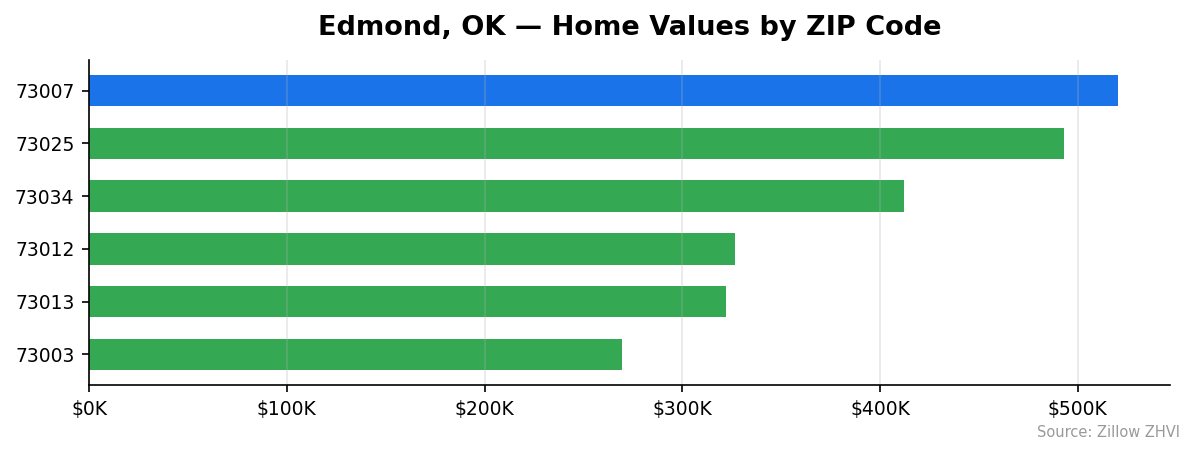
| ZIP Code | Typical Home Value | Monthly Rent |
|---|---|---|
| 73007 | $520,413 | Data not available |
| 73025 | $493,122 | Data not available |
| 73034 | $412,174 | $1,528 |
| 73012 | $326,607 | $1,754 |
| 73013 | $321,855 | $1,600 |
| 73003 | $269,732 | $1,567 |
Most Expensive
73007 leads Edmond at $520,413 — 33% above the city median and the only ZIP above the half-million mark. 73025 follows closely at $493,122, another premium area priced well above the citywide average. 73034 rounds out the top three at $412,174, with a relatively low rent of $1,528 that suggests strong owner-occupancy.
Most Affordable
73003 is the entry point into Edmond at $269,732, roughly 31% below the city median and the only ZIP under $300K. 73013 comes in at $321,855 with rents around $1,600 — a middle-ground option. 73012 at $326,607 has the highest rents in the city at $1,754, which may reflect newer rental stock or higher demand from tenants in that area.
Rent vs Buy in Edmond
Rent data is available for four of Edmond’s six ZIP codes. Monthly rents range from $1,528 in 73034 to $1,754 in 73012.
| ZIP Code | Monthly Rent | Home Value | Rent as % of Value |
|---|---|---|---|
| 73034 | $1,528 | $412,174 | 0.37% |
| 73003 | $1,567 | $269,732 | 0.58% |
| 73013 | $1,600 | $321,855 | 0.50% |
| 73012 | $1,754 | $326,607 | 0.54% |
At current mortgage rates near 6.5–7%, a buyer putting 20% down on the citywide median of $390,651 would finance about $312,521. That translates to a monthly payment of roughly $2,300–$2,500 before taxes and insurance. Add property taxes and insurance, and you’re looking at $2,700 or more.
Renting is cheaper across the board right now. The gap is especially wide in the higher-priced ZIPs. In 73034, rent of $1,528 is nearly $1,000 less per month than a mortgage on a $412K home.
The one exception: if you plan to stay 7+ years and prices continue rising, buying builds equity that renting never will. But on a pure monthly cash flow basis, renters have the advantage in 2026.
Population Growth and Migration
Edmond added 4,290 residents between 2020 and 2024, growing 4.5% over four years.
| Year | Population |
|---|---|
| 2020 | 94,750 |
| 2021 | 95,375 |
| 2022 | 96,565 |
| 2023 | 98,344 |
| 2024 | 99,040 |
Growth accelerated in 2022 and 2023, with the city adding nearly 1,800 people in 2023 alone. The pace slowed slightly in 2024, but Edmond is on track to cross 100,000 residents soon.
| City | 2024 Population | 4-Year Growth |
|---|---|---|
| Broken Arrow | 122,756 | 7.7% |
| Oklahoma City | 712,919 | 4.4% |
| Edmond | 99,040 | 4.5% |
| Stillwater | 50,138 | 3.6% |
| Norman | 131,010 | 2.2% |
| Moore | 63,845 | 1.2% |
Edmond’s 4.5% growth rate matches Oklahoma City and trails only Broken Arrow among major Oklahoma cities. Steady population gains put upward pressure on housing demand. More people competing for homes — especially in a city with finite land and established neighborhoods — supports prices even when the broader market is flat.
Edmond Housing Market Trends
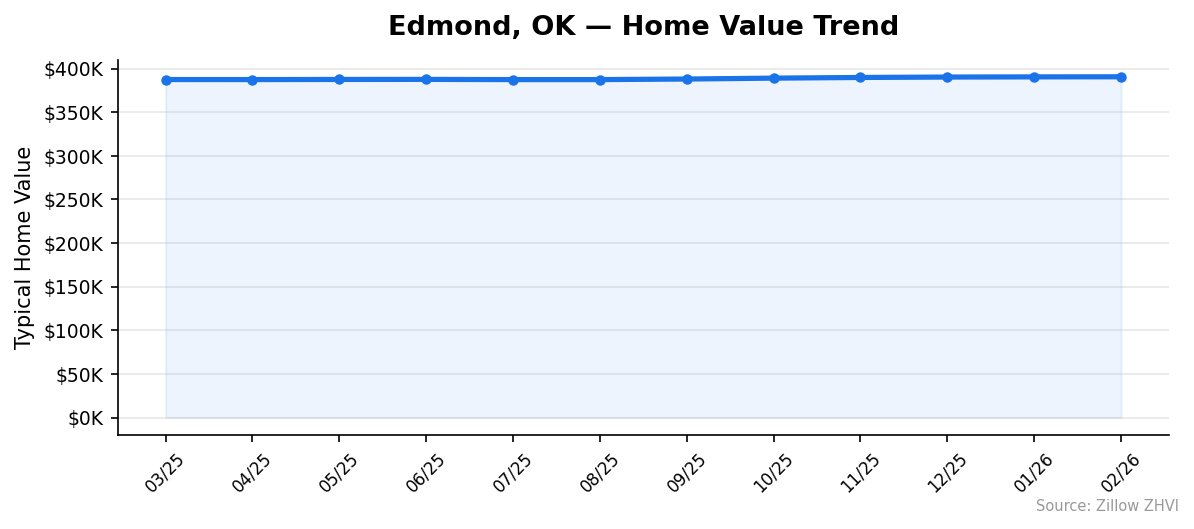
Here’s how the typical home value moved month by month over the past year:
| Month | Avg Home Value | Low ZIP | High ZIP |
|---|---|---|---|
| Feb 2026 | $390,651 | $269,732 | $520,413 |
| Jan 2026 | $390,543 | $269,326 | $520,473 |
| Dec 2025 | $390,342 | $268,505 | $520,743 |
| Nov 2025 | $389,867 | $267,528 | $520,652 |
| Oct 2025 | $389,105 | $266,564 | $519,704 |
| Sep 2025 | $388,086 | $265,976 | $517,319 |
| Aug 2025 | $387,438 | $265,888 | $515,505 |
| Jul 2025 | $387,425 | $266,194 | $515,171 |
| Jun 2025 | $387,675 | $266,474 | $516,479 |
| May 2025 | $387,605 | $266,633 | $517,210 |
| Apr 2025 | $387,463 | $266,811 | $517,979 |
| Mar 2025 | $387,505 | $267,481 | $517,743 |
The trend tells a clear story. Prices dipped slightly through the spring and summer of 2025, bottoming near $387,425 in July. Since then, the city average has climbed every single month, gaining $3,226 from July 2025 to February 2026.
That’s not a boom. It’s a grind higher. Monthly gains have been small — $100 to $1,000 at a time — but the direction has been consistently upward since mid-2025.
The cheapest ZIP (73003) has tracked the steepest recovery, rising from $265,888 in August to $269,732 in February. The most expensive ZIP (73007) moved from $515,171 to $520,413 over the same period.
Is Edmond a Good Place to Buy in 2026?
The data points to a balanced market. Prices are rising, but barely — 0.8% per year won’t create bidding wars.
For buyers: you have time. There’s no price spiral forcing rushed decisions. The range from $270K to $520K across six ZIPs means you can find something at multiple price points within city limits.
For sellers: don’t expect a windfall. Appreciation is running below inflation. If you bought recently and need to sell, you may break even after transaction costs — but probably won’t profit much.
The strongest argument for buying in Edmond is the population trend. A city adding 1,000+ residents per year, approaching 100K, with growth rates that match OKC proper — that’s a demand signal. Housing supply doesn’t expand fast in established suburbs, so even modest population growth supports prices long-term.
Edmond Housing Market Outlook for 2026-2027
The 8-month upward streak from July 2025 through February 2026 shows clear momentum. If the current pace of roughly $400–$500 per month continues, expect the citywide median to reach $393,000–$395,000 by the end of 2026.
That’s a 1–1.5% gain from current levels.
The 3-month trend from December to February — gains of $100 to $300 per month — suggests the pace is actually slowing, not accelerating. Don’t expect a breakout. This market is likely to remain in the low single-digit growth range through 2027 unless mortgage rates drop sharply or new employers move into the metro area.
The floor appears well-established. Prices haven’t fallen month-over-month since mid-2025.
Similar Markets in OK
If you’re considering Edmond, these Oklahoma cities offer different price points and trade-offs:
- Oklahoma City — The metro core with more inventory and lower price points than Edmond’s suburbs
- Norman — University town south of OKC, popular with younger buyers and faculty
- Broken Arrow — Tulsa suburb with the state’s fastest population growth at 7.7%
- Tulsa — Oklahoma’s second-largest city with a broader range of neighborhoods and prices
- Midwest City — OKC metro option near Tinker AFB, typically priced well below Edmond
Frequently Asked Questions
What is the average home price in Edmond?
The typical home in Edmond is valued at $390,651 as of February 2026. That figure represents the Zillow Home Value Index for the city, covering homes in the 35th to 65th percentile. Actual prices range from $269,732 in ZIP 73003 to $520,413 in ZIP 73007.
Are home prices going up or down in Edmond?
Prices are up 0.8% year over year. The monthly trend shows eight consecutive months of gains since July 2025, though each monthly increase has been small. This is a slowly appreciating market, not a fast-moving one.
Is it cheaper to rent or buy in Edmond?
Renting is cheaper right now. Typical rents run $1,528 to $1,754 per month, while a mortgage on the median-priced home would cost $2,300–$2,500 per month before taxes and insurance. The gap narrows in the more affordable ZIPs like 73003.
What is the most affordable neighborhood in Edmond?
ZIP code 73003 has the lowest typical home value at $269,732 — about 31% below the citywide median. Monthly rent in 73003 averages $1,567. It’s the clearest entry point for buyers looking to get into Edmond at a lower price.
Methodology
Home values are based on the Zillow Home Value Index (ZHVI), a smoothed measure of typical home values in the 35th to 65th percentile range. Rent estimates use the Zillow Observed Rent Index (ZORI). Population figures come from the U.S. Census Bureau Population Estimates Program (2020-2024 vintage). All datasets are publicly available. Housing data updated 2026-02-28.