Orem Home Prices: $516K, Up 3.8% — 3 ZIPs Analyzed (2026)
$515,535. That’s the typical home value in Orem, UT as of February 2026. Prices are up 3.8% from a year ago — and they’ve climbed every single month since last summer, even as the city itself has been losing residents.
Quick answer: The average home price in Orem, UT is $515,535 as of February 2026, up 3.8% year over year according to Zillow.
Current Home Prices in Orem
Orem sits firmly in mid-six-figure territory. The typical home value of $515,535 puts it below Salt Lake City pricing tiers but well above the national median. Year-over-year, values are up 3.8%.
| Metric | Value |
|---|---|
| Median home value | $515,535 |
| Year-over-year change | +3.8% |
| Most affordable ZIP | $471,160 (84057) |
| Most expensive ZIP | $590,907 (84097) |
| Price range across ZIPs | $119,747 |
| ZIP codes analyzed | 3 |
| Data through | February 2026 |
The spread between Orem’s cheapest and most expensive neighborhood is about $120,000. That’s a meaningful gap for a city of fewer than 100,000 people. If you’re shopping in 84097 versus 84057, you’re looking at two different price tiers — roughly 25% apart.
The 3.8% annual gain is worth pausing on. National averages have been mixed in early 2026, and parts of the Mountain West have seen flat or declining prices. Orem’s appreciation puts it in the stronger half of the region, though not at the top. Provo metro demand — much of it spillover from Lehi and Utah County’s tech corridor — keeps showing up in Orem’s numbers despite the city’s own population decline.
You won’t find sub-$400K medians anywhere in Orem. Even the cheapest ZIP starts in the high $400Ks.
Orem Home Prices by Neighborhood
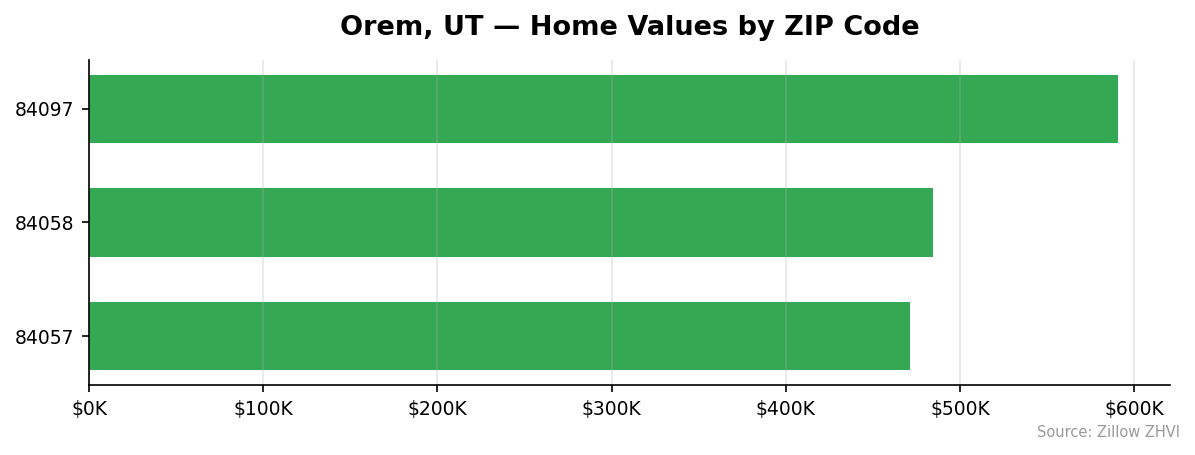
Three ZIP codes cover Orem. Here’s how each one prices out.
| ZIP | Median Home Value | Median Rent |
|---|---|---|
| 84057 | $471,160 | $1,565 |
| 84058 | $484,536 | $1,467 |
| 84097 | $590,907 | $1,467 |
Most Expensive
- 84097 — $590,907. Orem’s premium ZIP, running about 15% above the citywide average. Despite the higher home values, rents in 84097 actually trail 84057, suggesting more owner-occupied housing stock here.
Most Affordable
- 84057 — $471,160. The cheapest entry point in Orem, about 9% below the city average. It also commands the highest median rent in the city at $1,565, which signals stronger rental demand relative to purchase prices.
- 84058 — $484,536. The middle tier, roughly 6% under the Orem average. Rents here match 84097, but home prices sit nearly $106,000 lower.
If affordability is the priority, 84057 and 84058 together cover most of Orem’s sub-$500K inventory.
Rent vs Buy in Orem
Renting wins on monthly cash flow — and it’s not close.
| Cost | |
|---|---|
| Median rent (citywide avg) | ~$1,500/month |
| Mortgage (P&I, 20% down, 7%, $515K) | ~$2,745/month |
| Property tax + insurance estimate | ~$400/month |
| Total estimated buy cost | ~$3,145/month |
That’s a roughly $1,650/month gap. Over a year, renting saves about $19,800 in monthly outlay versus buying — though buyers build equity that renters don’t.
ZIP-level rents tell a flatter story than home prices. Two of the three ZIPs (84058 and 84097) sit right at $1,467. The third, 84057, runs $98 higher. Total spread: less than $100/month. Compare that to the $120K spread on home values, and it’s clear the rental market in Orem is more uniform than the purchase market.
The gap between rent and ownership cost suggests Orem currently favors renters on monthly economics. Buyers are paying for appreciation upside (3.8% YoY), tax benefits, and equity — not lower monthly payments. If you plan to stay fewer than 5 years, the math on buying gets harder fast.
Population Growth and Migration
Orem is losing people. The population fell from 98,428 in 2020 to 96,646 in 2024 — a 1.8% decline.
| Year | Population |
|---|---|
| 2020 | 98,428 |
| 2021 | 98,212 |
| 2022 | 96,312 |
| 2023 | 96,403 |
| 2024 | 96,646 |
The drop happened mostly between 2021 and 2022. Since then, Orem has stabilized but not recovered. Meanwhile, surrounding cities are growing fast.
| City | 2024 Population | 4-Year Growth |
|---|---|---|
| Lehi | 93,446 | +21.6% |
| St. George | 106,288 | +10.7% |
| South Jordan | 86,156 | +10.5% |
| Salt Lake City | 217,783 | +8.5% |
| Layton | 84,348 | +2.8% |
| Orem | 96,646 | −1.8% |
Lehi — Orem’s neighbor up I-15 — added enough residents to nearly match Orem’s total. That’s where much of the regional growth is going.
Yet Orem home prices keep rising. That tension matters. When a market appreciates without population growth, the demand is coming from somewhere else: in-migration from higher-cost states, investor purchases, or residents trading up within the area. Static or shrinking demographics with rising prices is a less stable combination than growth-driven appreciation, and worth watching if you’re buying for the long term.
Orem Housing Market Trends
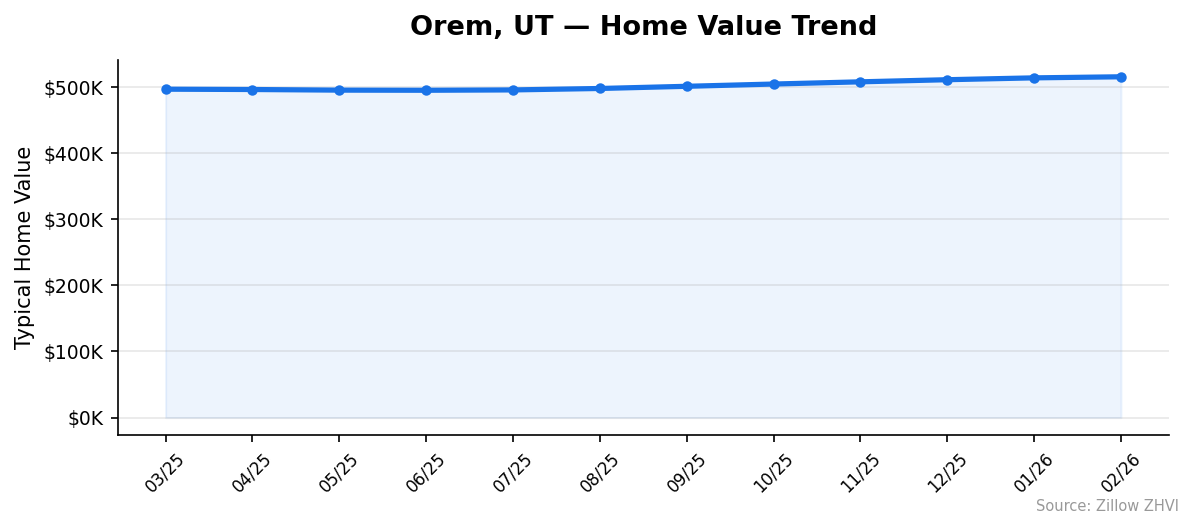
Orem prices bottomed in June 2025 and have moved up every month since.
| Month | Median Value |
|---|---|
| Mar 2025 | $496,769 |
| Apr 2025 | $496,292 |
| May 2025 | $495,347 |
| Jun 2025 | $495,147 |
| Jul 2025 | $495,676 |
| Aug 2025 | $497,842 |
| Sep 2025 | $501,151 |
| Oct 2025 | $504,572 |
| Nov 2025 | $507,918 |
| Dec 2025 | $511,111 |
| Jan 2026 | $513,919 |
| Feb 2026 | $515,535 |
From the June 2025 low, prices added $20,388 in eight months. That works out to roughly $2,500 per month of appreciation. The pace has been remarkably steady — no single month moved more than 0.7% — which suggests this isn’t a speculative spike but a slow grind upward.
The 12-month range tops out at the latest reading. Every month from August forward set a new high. There is no sign in the data of a ceiling being hit.
Is Orem a Good Place to Buy in 2026?
The signals are mixed.
In favor of buying: prices are in a clear uptrend, the appreciation is consistent (not volatile), and supply is constrained by Orem’s small geographic footprint. Three ZIP codes don’t leave much room for new construction at scale.
Against buying: rent is dramatically cheaper on a monthly basis, the population is shrinking, and the 3.8% YoY gain barely outpaces the cost of carrying a mortgage versus renting. If appreciation slows, the math flips fast.
This looks more like a seller’s market than a buyer’s market — sellers have eight straight months of price gains behind them. But it’s not a frenzy. A patient buyer who can wait for the right ZIP and the right house has time to be selective.
Orem Housing Market Outlook for 2026-2027
The 3-month trend (December through February) shows monthly gains of $2,808, $2,808, and $1,616. The pace appears to be moderating slightly even as direction stays positive.
If the current pace continues, Orem would cross $525,000 by mid-2026. The trajectory has been remarkably linear since June 2025, which makes near-term direction more predictable than usual.
What could break the pattern: a meaningful shift in mortgage rates, a continuation of the population decline trend that started in 2021-2022, or rental softening that pulls investor demand out of the market. None of those are visible in the data through February 2026.
The 8-month uptrend is the dominant signal. Until something disrupts it, the path of least resistance for Orem prices is up.
Similar Markets in UT
- Provo — Orem’s twin city in the same metro, the closest direct comparison for Utah County buyers.
- Salt Lake City — the regional benchmark, generally pricier but with more inventory and ZIP variety.
- Sandy — a Salt Lake suburb with similar mid-tier pricing dynamics to Orem.
- Ogden — north of Salt Lake, typically a step down on price for budget-focused buyers priced out of Orem.
- West Jordan — another Salt Lake suburb worth comparing if you’re flexible on commute.
Frequently Asked Questions
What is the average home price in Orem?
The average home price in Orem, UT is $515,535 as of February 2026. That number is the typical value across the city’s three ZIP codes — 84057, 84058, and 84097 — based on the Zillow Home Value Index.
Are home prices going up or down in Orem?
Prices are up 3.8% year over year. The market bottomed in June 2025 at $495,147 and has gained roughly $20,000 across eight consecutive monthly increases since then. The trend through February 2026 is consistent and upward.
Is it cheaper to rent or buy in Orem?
Renting is much cheaper month to month. Median rent across Orem ZIPs sits near $1,500, while a mortgage on a typical $515,535 home with 20% down at current rates runs about $3,145 once taxes and insurance are included. That’s a $1,600+ monthly gap in favor of renting.
What is the most affordable neighborhood in Orem?
ZIP 84057 is the cheapest at $471,160 — about 9% below the citywide average. It also has the highest median rent in Orem at $1,565, which suggests strong rental demand. The next-cheapest is 84058 at $484,536.
Methodology
Home values are based on the Zillow Home Value Index (ZHVI), a smoothed measure of typical home values in the 35th to 65th percentile range. Rent estimates use the Zillow Observed Rent Index (ZORI). Population figures come from the U.S. Census Bureau Population Estimates Program (2020-2024 vintage). All datasets are publicly available. Housing data updated 2026-02-28.