West Valley City Home Prices: $462K, Up 1.1% — 3 ZIPs Analyzed (2026)
$462,144. That’s what a typical home costs in West Valley City right now — and it’s been climbing.
Prices ticked up 1.1% over the past year, a modest but steady gain in a metro where Salt Lake City proper has priced out many first-time buyers. West Valley City remains one of the more affordable entry points along the Wasatch Front, but that gap is narrowing.
Quick answer: The average home price in West Valley City, UT is $462,144 as of February 2026, up 1.1% year over year according to Zillow.
Current Home Prices in West Valley City
Here’s where things stand as of February 2026:
| Metric | Value |
|---|---|
| Median Home Price | $462,144 |
| Year-over-Year Change | +1.1% |
| Lowest ZIP Median | $432,112 |
| Highest ZIP Median | $487,953 |
| ZIP Codes Tracked | 3 |
The $462K median puts West Valley City in a narrow band. The gap between the cheapest and most expensive ZIP is about $56,000 — not a massive spread. That tells you pricing is relatively uniform across the city.
A year ago, the median sat around $457,000. The 1.1% increase translates to roughly $5,000 in added value. Not a windfall for existing owners, but enough to keep equity moving in the right direction.
One thing worth watching: the price floor. The cheapest ZIP hasn’t dropped below $428,000 in the past 12 months. Buyers hoping for a dip into the low $400Ks haven’t gotten one.
West Valley City Home Prices by Neighborhood
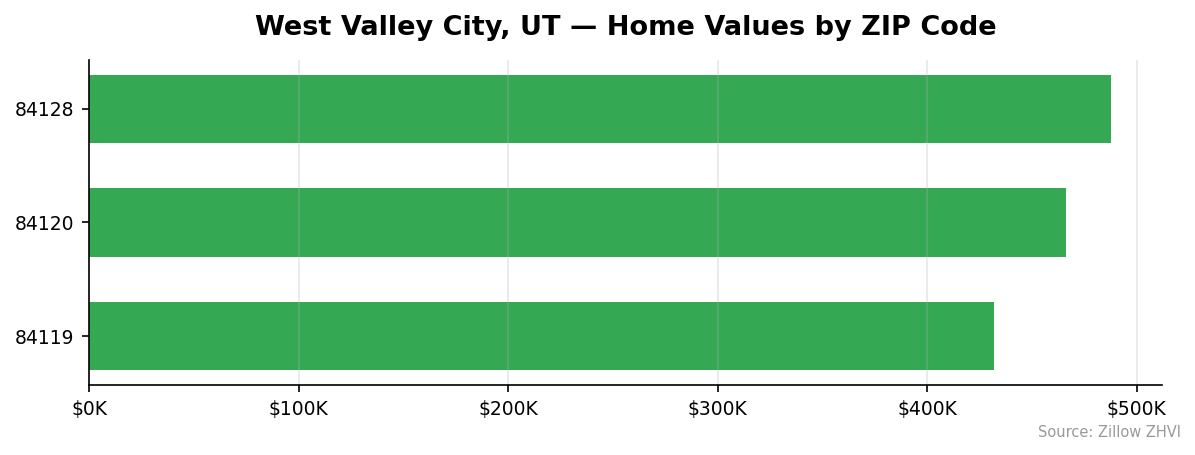
All three tracked ZIP codes show meaningful price differences despite covering a single city.
| ZIP Code | Median Home Price | Monthly Rent |
|---|---|---|
| 84119 | $432,112 | $1,475 |
| 84120 | $466,366 | $1,905 |
| 84128 | $487,953 | $1,622 |
Most Expensive
84128 leads at $487,953, sitting about $26K above the city median. Interestingly, its rent ($1,622) is lower than 84120’s, which could signal stronger owner-occupancy rates in that ZIP.
Most Affordable
84119 comes in at $432,112, roughly $30K below the city average. It also carries the lowest rent at $1,475 per month, making it the most accessible ZIP for both buyers and renters in West Valley City.
84120 splits the middle at $466,366 but commands the highest rent in the city at $1,905. That gap between 84120’s rent and 84128’s rent — despite 84128 having higher home values — is unusual. Renters in 84120 are paying a premium relative to what ownership costs there.
Rent vs Buy in West Valley City
Monthly rents across West Valley City range from $1,475 to $1,905. Here’s how they stack up against estimated mortgage payments.
| ZIP | Monthly Rent | Est. Mortgage (6.5%, 20% down) | Difference |
|---|---|---|---|
| 84119 | $1,475 | ~$2,186 | Rent saves $711/mo |
| 84120 | $1,905 | ~$2,404 | Rent saves $499/mo |
| 84128 | $1,622 | ~$2,514 | Rent saves $892/mo |
At current rates, renting is cheaper across every ZIP code. The mortgage estimates above don’t include property taxes, insurance, or maintenance — which would push the buy cost even higher.
The most lopsided gap is in 84128. You’d pay $892 more per month to own versus rent there. That’s over $10,700 a year in additional housing costs before equity buildup.
For 84120, the math is closer. If you’re already paying $1,905 in rent, the jump to a $2,404 mortgage is less painful — and you’d be building equity at $466K.
The rent-vs-buy decision ultimately depends on how long you plan to stay. At 1.1% annual appreciation, it takes years for equity gains to offset the higher monthly cost of ownership.
Population Growth and Migration
West Valley City’s population has been slipping. The city went from 139,995 residents in 2020 to 138,144 in 2024 — a 1.3% decline over four years.
| Year | Population |
|---|---|
| 2020 | 139,995 |
| 2021 | 139,128 |
| 2022 | 137,378 |
| 2023 | 137,592 |
| 2024 | 138,144 |
The sharpest drop came between 2021 and 2022, when the city lost about 1,750 residents. Since then, population has stabilized and even ticked up slightly. The 2024 figure is higher than both 2022 and 2023.
Compare that to other Utah cities:
| City | 2024 Population | 4-Year Growth |
|---|---|---|
| Salt Lake City | 217,783 | +8.5% |
| Lehi | 93,446 | +21.6% |
| St. George | 106,288 | +10.7% |
| South Jordan | 86,156 | +10.5% |
| Layton | 84,348 | +2.8% |
| West Valley City | 138,144 | -1.3% |
West Valley City is the only city on this list losing residents. Lehi’s 21.6% growth is staggering by comparison. Some of those departures from West Valley City likely ended up in faster-growing suburbs along the I-15 corridor.
For housing demand, the flat population means no organic demand pressure from population growth. The 1.1% price increase is driven by other factors — likely low inventory and spillover demand from pricier Salt Lake City.
West Valley City Housing Market Trends
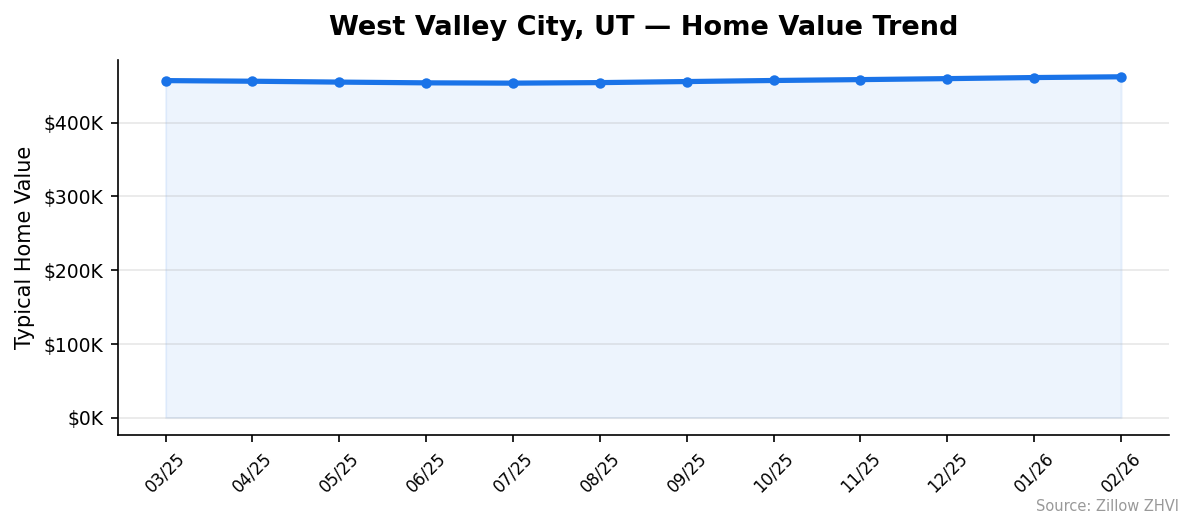
The 12-month price trajectory shows a clear pattern: a dip in mid-2025 followed by steady recovery.
| Month | Average Price | Low (ZIP) | High (ZIP) |
|---|---|---|---|
| Feb 2026 | $462,144 | $432,112 | $487,953 |
| Jan 2026 | $461,120 | $431,804 | $486,472 |
| Dec 2025 | $459,654 | $430,975 | $484,572 |
| Nov 2025 | $458,324 | $430,243 | $482,650 |
| Oct 2025 | $457,126 | $429,661 | $480,953 |
| Sep 2025 | $455,688 | $428,996 | $479,061 |
| Aug 2025 | $454,247 | $428,276 | $477,486 |
| Jul 2025 | $453,537 | $428,242 | $476,686 |
| Jun 2025 | $453,933 | $429,021 | $477,129 |
| May 2025 | $454,935 | $430,132 | $478,224 |
| Apr 2025 | $456,125 | $431,229 | $479,630 |
| Mar 2025 | $456,976 | $432,020 | $480,600 |
Prices started at $456,976 in March 2025, dipped to a low of $453,537 in July, then climbed for seven straight months to reach $462,144 in February 2026.
That July trough to February peak represents a $8,607 gain — about 1.9% in eight months. The recovery has been slow but unbroken. No month-over-month decline since July 2025.
The spread between the cheapest and most expensive ZIPs has also widened slightly, from about $48K in March 2025 to $56K in February 2026. Higher-priced areas are appreciating faster.
Is West Valley City a Good Place to Buy in 2026?
The data paints a picture of a stable, modestly appreciating market.
At $462K, West Valley City sits below Salt Lake City proper and well below the south valley suburbs like South Jordan. For buyers priced out of those areas, West Valley City offers a lower entry point with access to the same metro job market.
The 1.1% annual appreciation won’t build wealth quickly. But it also means you’re unlikely to buy into a price bubble. Seven consecutive months of gains suggest the floor is solid.
Risks: the declining population is a yellow flag. Cities that lose residents eventually see softer demand. The stabilization in 2023-2024 is encouraging, but a return to outflow could pressure prices.
For renters considering a switch to ownership, the math currently favors renting from a monthly cash-flow perspective. Buying makes more sense if you plan to stay five or more years and want to lock in costs against potential rent increases.
West Valley City Housing Market Outlook for 2026-2027
The seven-month uptrend from July 2025 to February 2026 shows no signs of reversing. Monthly gains have been consistent, averaging about $1,000 to $1,200 per month.
If the current pace continues, the median could reach the $470K range by late 2026. That would represent a roughly $8K increase from current levels.
The 3-month trend from December to February shows acceleration — gains of $1,500 per month versus $1,100 earlier in the recovery. Whether that pace holds through summer selling season will depend on inventory levels and mortgage rates.
Don’t expect a breakout. West Valley City’s flat population growth limits upside pressure. But the steady climb suggests $450K is now in the rearview mirror.
Similar Markets in UT
If you’re shopping in West Valley City, these nearby Utah markets are worth comparing:
- Buyers looking for a similar price point might consider West Jordan, West Valley City’s neighbor to the south.
- Ogden offers a more affordable alternative about 35 miles north along I-15.
- Salt Lake City is the metro anchor — expect higher prices but more inventory.
- Sandy sits on the east bench and typically commands a premium over West Valley City.
- Provo draws buyers willing to commute south for a university-town feel.
Frequently Asked Questions
What is the average home price in West Valley City?
The average home price in West Valley City is $462,144 as of February 2026. Prices across the city’s three tracked ZIP codes range from $432,112 in 84119 to $487,953 in 84128. That’s a $56K spread within a single city.
Are home prices going up or down in West Valley City?
Prices are going up. The median rose 1.1% year over year, and the market has posted seven consecutive months of gains since bottoming out at $453,537 in July 2025. The trend is gradual but persistent.
Is it cheaper to rent or buy in West Valley City?
Renting is cheaper on a monthly basis across all three ZIP codes. The most affordable rent is $1,475 in 84119, while the estimated mortgage payment on that ZIP’s median home would run about $2,186 — a $711 gap. Buying builds equity, but the cash-flow advantage clearly sits with renting at today’s rates.
What is the most affordable neighborhood in West Valley City?
ZIP code 84119 is the most affordable, with a median home price of $432,112 and monthly rent of $1,475. It’s about $30,000 below the citywide median and offers the lowest housing costs in West Valley City by both measures.
Methodology
Home values are based on the Zillow Home Value Index (ZHVI), a smoothed measure of typical home values in the 35th to 65th percentile range. Rent estimates use the Zillow Observed Rent Index (ZORI). Population figures come from the U.S. Census Bureau Population Estimates Program (2020-2024 vintage). All datasets are publicly available. Housing data updated 2026-02-28.