Overland Park Home Prices: $475K, Up 4.4% — 8 ZIPs (2026)
$475,330. That’s the typical home value in Overland Park as of February 2026, up 4.4% from a year ago. While much of the country saw prices stall or slip, Kansas’s largest suburb kept climbing.
Quick answer: The average home price in Overland Park, KS is $475,330 as of February 2026, up 4.4% year over year according to Zillow.
Current Home Prices in Overland Park
Overland Park sits well above the Kansas state norm but stays cheaper than coastal markets people compare it to. The 4.4% annual gain puts it ahead of most metros tracked nationally for the same period.
| Metric | Value |
|---|---|
| Median home value | $475,330 |
| Year-over-year change | +4.4% |
| Cheapest ZIP | 66204 — $301,084 |
| Most expensive ZIP | 66221 — $789,593 |
| ZIP price spread | $488,509 |
| Data through | February 2026 |
The gap between the cheapest and most expensive ZIPs runs nearly half a million dollars. That spread tells you something about the city: a buyer with a $300K budget and a buyer with a $750K budget can both find a home here, just on opposite sides of town.
The citywide median has gained roughly $20,000 over the past 12 months. That works out to about $1,675 per month in equity for a homeowner — close to what an average renter pays in monthly rent across the city.
For context, the median value of $475,330 sits roughly 30% above the typical Kansas home price and roughly 10% above the U.S. median. Overland Park has stayed ahead of regional comparables like Wichita and Topeka by a wide margin for years.
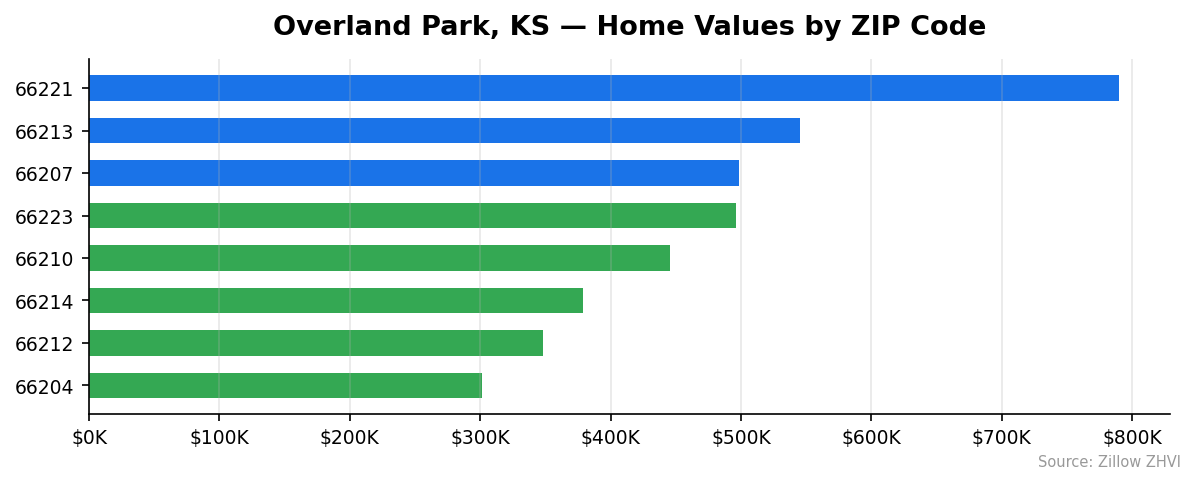
Overland Park Home Prices by Neighborhood
Eight ZIP codes make up the Overland Park market. The price gap between the top and bottom is wider than the median home value itself.
| ZIP Code | Typical Home Value | Avg. Monthly Rent | vs. City Median |
|---|---|---|---|
| 66221 | $789,593 | $1,530 | +66% |
| 66213 | $545,389 | $1,661 | +15% |
| 66207 | $498,111 | $2,055 | +5% |
| 66223 | $496,266 | $1,894 | +4% |
| 66210 | $445,275 | $1,586 | -6% |
| 66214 | $378,480 | $1,244 | -20% |
| 66212 | $348,438 | $1,852 | -27% |
| 66204 | $301,084 | $1,561 | -37% |
Most Expensive
- 66221 — $789,593. The far-south corridor near 159th Street, where new construction and larger lots push values past three-quarters of a million. Rent runs surprisingly low here at $1,530, suggesting most homes are owner-occupied.
- 66213 — $545,389. The 119th Street corridor, anchored by office parks and newer subdivisions. Prices sit 15% above the city median.
- 66207 — $498,111. Just under the $500K mark, this ZIP carries the highest average rent in the city at $2,055 per month.
Most Affordable
- 66204 — $301,084. The cheapest entry point in Overland Park. Homes here cost 37% less than the city median, with rent at $1,561.
- 66212 — $348,438. Older mid-century housing stock north of I-435. Rent at $1,852 runs higher than the home values would suggest, hinting at strong tenant demand.
- 66214 — $378,480. The lowest rent in the city ($1,244) lives here, paired with home values 20% below the median.
Rent vs Buy in Overland Park
Average rent across the eight ZIPs comes to about $1,673 per month. Buying the median home tells a different story.
At $475,330 with 20% down ($95,066), a 30-year fixed mortgage at recent rates lands near $2,530 in principal and interest. Add property tax (Kansas effective rates around 1.4% on the assessed value, roughly $554/month) and homeowner’s insurance (~$150/month), and the all-in monthly cost runs about $3,234.
| Cost | Monthly |
|---|---|
| Average rent (citywide) | $1,673 |
| Mortgage P&I (20% down) | ~$2,530 |
| Property tax | ~$554 |
| Insurance | ~$150 |
| Total ownership cost | ~$3,234 |
| Monthly difference | +$1,561 to buy |
Renting wins on monthly cash flow by roughly $1,560. That advantage erodes if you stay long enough to build equity — the citywide median gained $20,000 in the past year alone. ZIP 66207 is the only neighborhood where rent ($2,055) cracks the $2,000 ceiling, and even there, buying still costs more month to month.
The buy-vs-rent math here favors renters with short horizons and buyers planning to stay five-plus years.
Population Growth and Migration
Overland Park added 5,041 residents between 2020 and 2024, a 2.5% increase. The growth has been consistent rather than explosive — the city gained between 1,000 and 1,700 people every year of the period.
| Year | Population |
|---|---|
| 2020 | 197,852 |
| 2021 | 199,088 |
| 2022 | 200,353 |
| 2023 | 201,223 |
| 2024 | 202,893 |
Compared to nearby Kansas cities, Overland Park is growing slower than its neighbors but adding far more bodies in absolute terms. Olathe leads the region in growth rate.
| City | 2024 Population | 4-Year Growth |
|---|---|---|
| Overland Park | 202,893 | +2.5% |
| Olathe | 149,035 | +5.3% |
| Lawrence | 97,271 | +2.5% |
| Shawnee | 69,724 | +3.4% |
| Lenexa | 59,427 | +3.3% |
| Manhattan | 54,700 | +1.0% |
Steady population growth combined with limited new supply explains the 4.4% price gain. People keep arriving. Inventory hasn’t kept pace.
Overland Park Housing Market Trends
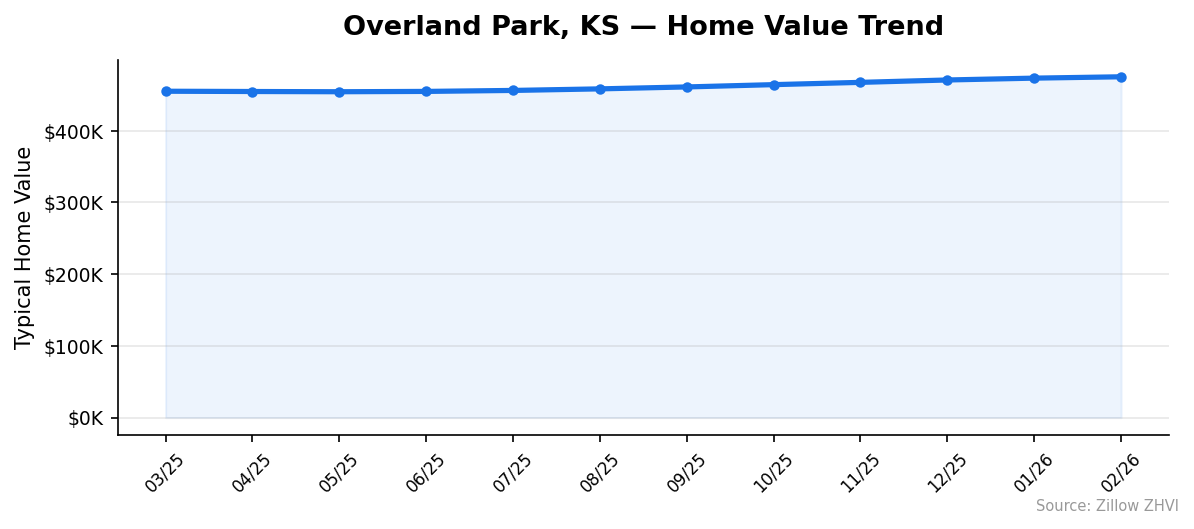
The 12-month trend shows uninterrupted price growth. Every single month posted a higher median than the one before it.
| Month | Median Home Value | MoM Change |
|---|---|---|
| Feb 2026 | $475,330 | +0.4% |
| Jan 2026 | $473,452 | +0.5% |
| Dec 2025 | $470,877 | +0.7% |
| Nov 2025 | $467,554 | +0.7% |
| Oct 2025 | $464,375 | +0.7% |
| Sep 2025 | $461,179 | +0.6% |
| Aug 2025 | $458,479 | +0.5% |
| Jul 2025 | $456,303 | +0.3% |
| Jun 2025 | $454,938 | +0.1% |
| May 2025 | $454,481 | -0.1% |
| Apr 2025 | $454,804 | -0.1% |
| Mar 2025 | $455,180 | — |
The pattern: a brief spring softening (March through May 2025), then nine straight months of acceleration. The strongest stretch ran October through December, with prices climbing 0.7% per month — annualized, that pace is over 8%.
Recent months show a slight cooldown back to roughly 0.4–0.5% monthly gains. Still positive, just less aggressive.
Is Overland Park a Good Place to Buy in 2026?
The case for buying: prices have moved up every month for nearly a year. Population is growing. Rent is cheap, but home equity gains are real — about $20,000 in the past 12 months on the typical home.
The case against: the median is now $475K, up from $455K a year ago. Affordability has compressed. The rent-vs-buy math heavily favors renting for anyone planning to stay fewer than five years.
This looks like a seller’s market on the data. Steady appreciation, no monthly price drops in nearly a year, and a population that grew in every measured year. Buyers with long horizons and stable income should treat current prices as the new floor rather than waiting for a dip — there’s no dip in this dataset.
For ZIP-level value hunters, 66204 and 66212 offer entry points 27–37% below the city median. Those neighborhoods carry the same school-district reputation that drives demand citywide, just with older housing stock.
Overland Park Housing Market Outlook for 2026-2027
The 3-month trend (December 2025 through February 2026) shows the market gaining about $1,600 to $3,300 per month, with momentum easing slightly. December was the hottest month at +0.7%; February cooled to +0.4%.
If the current pace continues, you’d expect the median to reach the $480,000–$485,000 range by mid-2026. The 12-month trajectory points toward continued gains through the back half of the year, though at a slower clip than the late-2025 surge.
What could change the trend: a meaningful rate cut would likely accelerate prices. A regional employment shock at one of the area’s large employers would slow them. Population growth in the surrounding cities (especially Olathe at +5.3%) suggests demand isn’t fading.
The data does not show any signal of a coming price drop.
Similar Markets in KS
Overland Park buyers priced out of the median can find lower entry points elsewhere in Kansas, while those wanting comparable or pricier alternatives have options too:
- Leawood — the most direct comparison, typically pricier than Overland Park.
- Lenexa — similar suburban character at a different price point, also growing.
- Olathe — fastest-growing nearby city at +5.3% population.
- Shawnee — another KC-metro suburb worth comparing.
- Kansas City — urban alternative across the metro.
- Lawrence — college-town economics roughly 40 miles west.
- Wichita — significantly cheaper, far from the KC metro.
Frequently Asked Questions
What is the average home price in Overland Park?
The average home price in Overland Park is $475,330 as of February 2026. That figure reflects the typical value across the city’s 8 ZIP codes, ranging from $301,084 in 66204 to $789,593 in 66221.
Are home prices going up or down in Overland Park?
Up. Prices rose 4.4% year over year and have gained every month for the past 11 months straight. The total dollar gain over the past year is roughly $20,150 on the typical home.
Is it cheaper to rent or buy in Overland Park?
Renting wins on monthly cost. Average rent runs about $1,673 per month, while owning the median home costs closer to $3,234 monthly once you add tax, insurance, and a 20%-down mortgage. The break-even on owning typically lands around year five, after equity gains catch up to the cash-flow gap.
What is the most affordable neighborhood in Overland Park?
ZIP 66204 is the cheapest at $301,084 — about 37% below the city median. Rent there averages $1,561 per month. ZIP 66212 ($348,438) and 66214 ($378,480) round out the three lowest-priced areas.
Methodology
Home values are based on the Zillow Home Value Index (ZHVI), a smoothed measure of typical home values in the 35th to 65th percentile range. Rent estimates use the Zillow Observed Rent Index (ZORI). Population figures come from the U.S. Census Bureau Population Estimates Program (2020-2024 vintage). All datasets are publicly available. Housing data updated 2026-02-28.