Wichita Home Prices: $229K, Up 1.8% — 20 ZIPs Analyzed (2026)
$229,361. That’s what a typical home is worth in Wichita as of February 2026. Prices are up 1.8% from a year ago, and the monthly trend shows eight straight months of gains after a summer soft patch.
Quick answer: The average home price in Wichita, KS is $229,361 as of February 2026, up 1.8% year over year according to Zillow.
Current Home Prices in Wichita
The typical Wichita home sits at $229,361. That’s a modest gain from last year, but the spread between neighborhoods is wide — the cheapest ZIP comes in under $90,000 while the priciest pushes past $428,000.
| Metric | Value |
|---|---|
| Median home value | $229,361 |
| Year-over-year change | +1.8% |
| Cheapest ZIP (67214) | $88,471 |
| Most expensive ZIP (67230) | $428,743 |
| Price range ratio | 4.8x |
| ZIP codes tracked | 20 |
| Data month | February 2026 |
A 4.8x gap between the cheapest and most expensive ZIP is unusually wide for a city of Wichita’s size. It means your neighborhood choice matters far more than the citywide median suggests.
The 1.8% annual gain is below the long-run US average but the direction has flipped. Back in July 2025 the typical value was $223,526 — $5,800 lower than today. Momentum is positive, not flat.
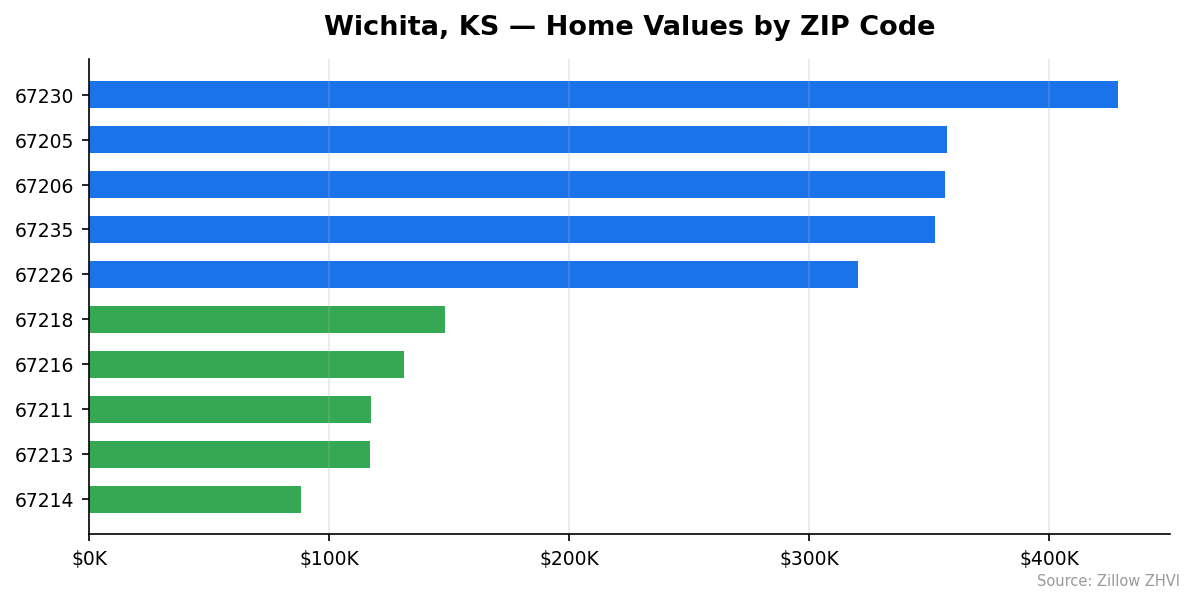
Wichita Home Prices by Neighborhood
All 20 tracked ZIP codes, sorted from most expensive to cheapest.
| ZIP | Typical Home Value | Typical Rent |
|---|---|---|
| 67230 | $428,743 | — |
| 67205 | $357,480 | $1,457 |
| 67206 | $356,560 | $957 |
| 67235 | $352,188 | — |
| 67226 | $320,255 | $1,313 |
| 67202 | $273,179 | $1,238 |
| 67215 | $256,503 | — |
| 67209 | $250,288 | $1,441 |
| 67220 | $242,286 | $1,607 |
| 67207 | $233,434 | $1,263 |
| 67212 | $232,305 | $1,213 |
| 67204 | $190,301 | $1,500 |
| 67208 | $173,364 | $947 |
| 67203 | $159,237 | $1,236 |
| 67217 | $158,961 | $1,131 |
| 67218 | $148,196 | $1,047 |
| 67216 | $131,160 | $1,027 |
| 67211 | $117,497 | $920 |
| 67213 | $116,820 | $923 |
| 67214 | $88,471 | $853 |
Most Expensive
- 67230 — $428,743. Far east Wichita and the top of the market, nearly double the citywide median.
- 67205 — $357,480. Northwest edge, where rents run $1,457 and home values sit 56% above the city average.
- 67206 — $356,560. East side high-end homes, priced similarly to 67205 but with much lower reported rents at $957.
Most Affordable
- 67214 — $88,471. Northeast central Wichita, the cheapest ZIP by a wide margin and the only one averaging under $900 in rent.
- 67213 — $116,820. South-central with rent at $923. Values here are about half the city median.
- 67211 — $117,497. Southeast with $920 rent. Both 67211 and 67213 offer entry-level pricing roughly 49% below median.
Rent vs Buy in Wichita
Average rent across the tracked ZIPs lands near $1,180 a month. Buying the median home is more expensive on paper.
| Scenario | Monthly Cost |
|---|---|
| Average rent (ZIP average, 2026) | ~$1,180 |
| Mortgage on $229,361 home (20% down, 7%) | ~$1,221 P&I |
| Add taxes, insurance, maintenance | ~$1,500-$1,600 total |
The math: renting saves roughly $300-$400 a month versus a median purchase. That’s the short-term view.
Buying still wins long-term if you stay five or more years, because rent goes to a landlord and mortgage payments build equity. It also hedges against future rent increases. At current prices, Wichita stays cheaper than almost every major metro either way — the median home costs less than one year of rent in San Francisco.
If you want the cheapest rent, ZIP 67214 averages $853. The priciest rents are in 67220 at $1,607, which is still below the typical US metro average.
Population Growth and Migration
Wichita added 2,924 residents between 2020 and 2024 — a 0.7% gain. Slow, but positive.
| Year | Population |
|---|---|
| 2020 | 398,067 |
| 2021 | 396,708 |
| 2022 | 396,203 |
| 2023 | 397,656 |
| 2024 | 400,991 |
The city lost population in 2021 and 2022 before rebounding. The 2024 count of 400,991 is the highest in the five-year window.
Compare that to other Kansas cities:
| City | 2024 Population | 4-Year Growth |
|---|---|---|
| Overland Park | 202,893 | +2.5% |
| Olathe | 149,035 | +5.3% |
| Lawrence | 97,271 | +2.5% |
| Shawnee | 69,724 | +3.4% |
| Lenexa | 59,427 | +3.3% |
| Wichita | 400,991 | +0.7% |
Every Kansas City suburb on this list is growing faster than Wichita in percentage terms. But Wichita is still more than twice the size of Overland Park, the state’s second-largest city. Slow growth at a large base still translates to steady housing demand — not the supercharged demand that pushes prices up double digits.
Wichita Housing Market Trends
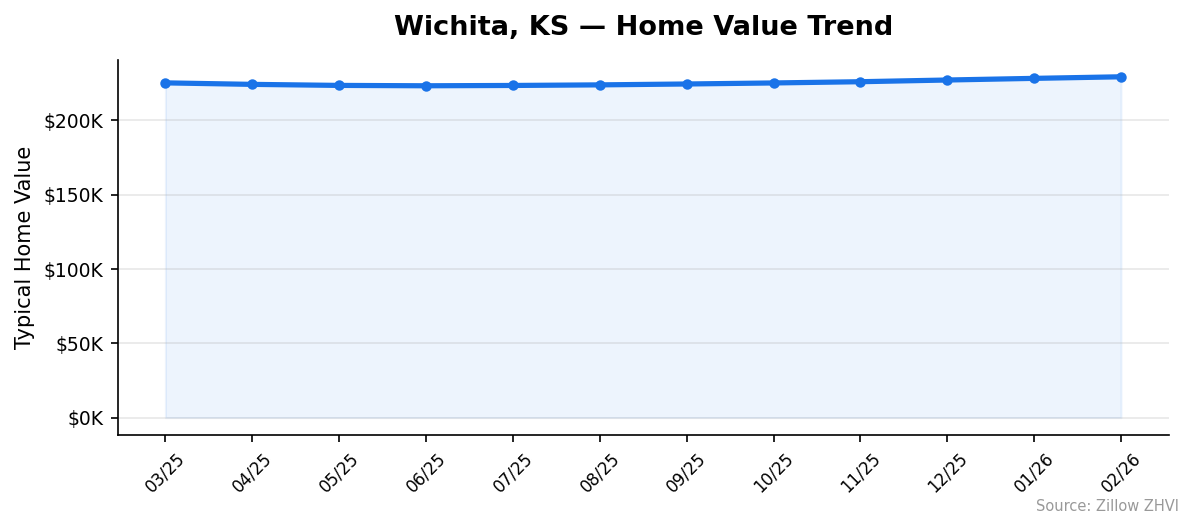
The 12-month price path tells a clearer story than the headline YoY number.
| Month | Typical Value |
|---|---|
| February 2026 | $229,361 |
| January 2026 | $228,300 |
| December 2025 | $227,191 |
| November 2025 | $226,044 |
| October 2025 | $225,212 |
| September 2025 | $224,515 |
| August 2025 | $223,920 |
| July 2025 | $223,526 |
| June 2025 | $223,314 |
| May 2025 | $223,560 |
| April 2025 | $224,257 |
| March 2025 | $225,264 |
Prices dipped from March 2025 through June 2025, bottoming at $223,314. Since then: eight consecutive monthly increases totaling $6,047.
The recent pace is faster than the annual rate. February 2026 added $1,061 over January. If that pace held for a year, Wichita would gain roughly 5.5% — triple the current YoY figure.
The trend is accelerating, not cooling.
Is Wichita a Good Place to Buy in 2026?
The case for buying: prices are low in absolute terms. Half the ZIPs are under $200,000. Inventory is plentiful by coastal standards. You can find a house with a yard for the price of a studio condo in San Jose.
The case for waiting: renting saves $300-$400 a month versus a median purchase, and prices are rising fast enough that you’re not missing a fire sale by delaying six months.
Eight straight months of gains with modest population growth behind it points to a mildly seller-friendly market, but not a frenzy. Listings aren’t getting bid up 20% over asking. Buyers have time to compare neighborhoods — and with a 4.8x price range between the cheapest and most expensive ZIP, comparing matters. Buy where the numbers fit your budget, not where the marketing brochure says you should.
Wichita Housing Market Outlook for 2026-2027
The 3-month trend suggests continued gains. Prices rose roughly $1,100 per month over December, January, and February. If the current pace continues, Wichita would cross $240,000 by late summer 2026.
Two things could change that. Population growth has to stay positive to support prices — the 2021-2022 dip shows Wichita is capable of shedding residents. And the acceleration from summer 2025 has to hold; a flat Q2 would pull the 12-month average back toward 1%.
For now, momentum is pointing up. Sellers have the mild advantage. Buyers who find the right ZIP still have room to negotiate because the price gap between neighborhoods is so wide.
Similar Markets in KS
- Overland Park — Wichita’s bigger Kansas City suburb rival, growing faster but priced higher.
- Kansas City — the state’s metro anchor on the Missouri border, a different market entirely.
- Lawrence — college-town demand drives prices above Wichita despite a quarter of the population.
- Topeka — the state capital offers a direct comparison to Wichita for affordability hunters.
- Lenexa — a smaller, faster-growing KC suburb with higher typical values.
Frequently Asked Questions
What is the average home price in Wichita?
The typical home in Wichita is worth $229,361 as of February 2026. That figure reflects the Zillow Home Value Index, which tracks the middle third of homes in the market rather than a simple listing average.
Are home prices going up or down in Wichita?
Up. Prices are 1.8% higher than a year ago and have risen eight months straight after a summer 2025 dip. Recent monthly gains average about $1,100, which is running faster than the annual pace.
Is it cheaper to rent or buy in Wichita?
Renting is cheaper in the short term. Average ZIP-level rent is around $1,180, while a mortgage on a median-priced home runs roughly $1,500 to $1,600 once you add taxes and insurance. Buying makes more sense if you plan to stay five-plus years and build equity.
What is the most affordable neighborhood in Wichita?
ZIP 67214 in northeast central Wichita has the lowest typical home value at $88,471 — less than half the citywide median. ZIPs 67213 and 67211 follow at roughly $117,000 each. All three also have the lowest rents in the city.
Methodology
Home values are based on the Zillow Home Value Index (ZHVI), a smoothed measure of typical home values in the 35th to 65th percentile range. Rent estimates use the Zillow Observed Rent Index (ZORI). Population figures come from the U.S. Census Bureau Population Estimates Program (2020-2024 vintage). All datasets are publicly available. Housing data updated 2026-02-28.