Oxnard Home Prices: $785K, Down 0.6% — 4 ZIPs Analyzed (2026)
Can you still afford a house in Oxnard? The median home sits at $785,175 — and for the first time in years, prices are moving in the buyer’s direction. Year over year, values dropped 0.6%. Not a crash. But a shift worth watching.
Quick answer: The average home price in Oxnard, CA is $785,175 as of February 2026, down 0.6% year over year according to Zillow.
Current Home Prices in Oxnard
Here’s where the Oxnard housing market stands right now:
| Metric | Value |
|---|---|
| Median Home Value | $785,175 |
| Year-over-Year Change | -0.6% |
| Lowest ZIP Median | $696,040 |
| Highest ZIP Median | $889,616 |
| Number of ZIP Codes Tracked | 4 |
| Data as of | February 2026 |
That -0.6% annual decline translates to roughly $5,100 lost in value over twelve months. For a market that spent years climbing, this is a notable stall.
The gap between the cheapest and most expensive neighborhoods is $193,576. That spread tells you Oxnard isn’t one market — it’s several. Where you buy matters more than when.
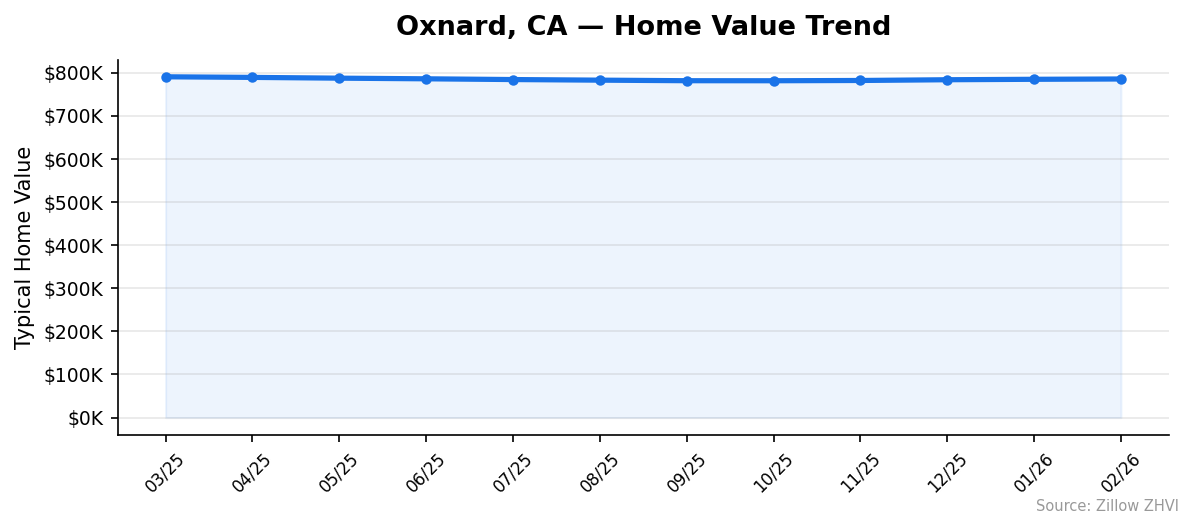
One year ago, in March 2025, the city-wide median was $790,264. Prices slid through the fall, hitting a low of $781,084 in October, before recovering slightly into early 2026. The current $785,175 figure sits below the spring 2025 peak but above the autumn trough.
For buyers, this means the window of softening prices may already be narrowing. The month-over-month increase from January ($784,450) to February ($785,175) was modest — $725 — but it marks the fourth consecutive monthly gain.
Oxnard Home Prices by Neighborhood
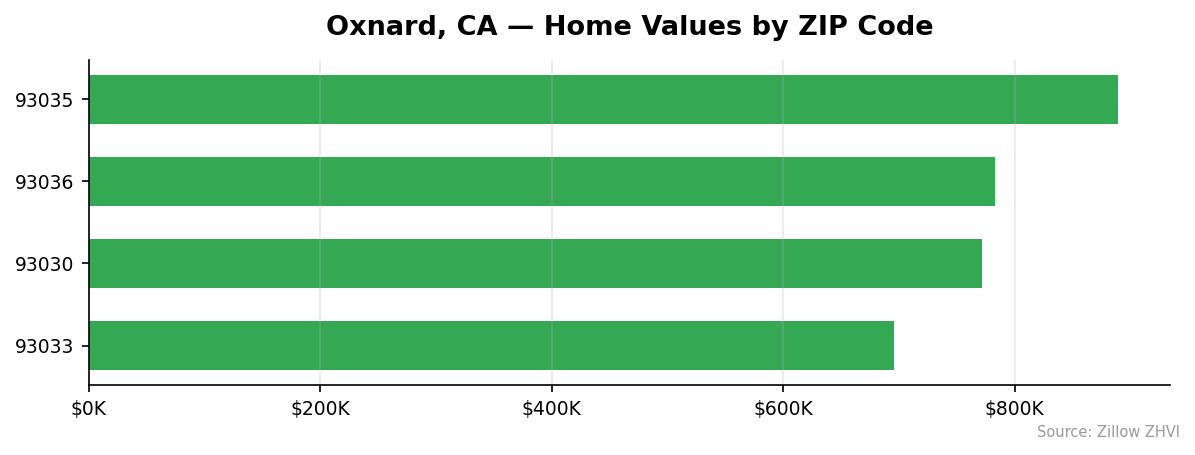
All four tracked ZIP codes show meaningful price differences:
| ZIP Code | Median Home Value | Avg. Monthly Rent |
|---|---|---|
| 93033 | $696,040 | $2,658 |
| 93030 | $771,906 | $2,796 |
| 93036 | $783,136 | $3,050 |
| 93035 | $889,616 | $3,375 |
Most Expensive
93035 tops the list at $889,616 — roughly $104,000 above the city median. Rents here run $3,375 per month, the highest in the city, which signals strong demand for the area.
Most Affordable
93033 is the entry point for Oxnard buyers at $696,040, a full $89,000 below the city-wide median. Rent is also the lowest at $2,658 per month. If you’re priced out of most Oxnard neighborhoods, 93033 is the ZIP to watch.
93030 splits the middle at $771,906. It offers a price roughly in line with the city average while keeping rent at a moderate $2,796.
Rent vs Buy in Oxnard
Renting wins on monthly cash flow right now, and it’s not close.
The average rent across Oxnard’s four tracked ZIPs comes to approximately $2,970 per month. Now compare that to buying. A mortgage on the median $785,175 home with 20% down ($157,035) leaves a loan balance of $628,140. At a 7% rate on a 30-year fixed mortgage, that’s roughly $4,178 per month in principal and interest alone — before property taxes, insurance, or maintenance.
| Cost | Monthly Amount |
|---|---|
| Average Rent | ~$2,970 |
| Mortgage (P&I, 20% down, 7%) | ~$4,178 |
| Difference | ~$1,208 |
You’d pay about $1,200 more per month to own. That gap shrinks if rates drop or if you factor in equity building and tax benefits. But on a pure cash-flow basis, renting is the cheaper option today.
The cheapest rent-to-own comparison is in 93033, where $2,658 rent competes against a mortgage on a $696,040 home — roughly $3,707 per month at the same terms. Even in the most affordable ZIP, buying costs over $1,000 more monthly.
Population Growth and Migration
Oxnard’s population has been essentially flat — and trending slightly down.
| Year | Population |
|---|---|
| 2020 | 201,908 |
| 2021 | 201,774 |
| 2022 | 200,499 |
| 2023 | 199,764 |
| 2024 | 200,616 |
The city lost 1,292 residents between 2020 and 2024, a decline of 0.6%. The steepest drop came between 2022 and 2023, when the population fell below 200,000. A modest rebound in 2024 brought the count back to 200,616.
Compare that with other California cities:
| City | 2024 Population | 4-Year Growth |
|---|---|---|
| Bakersfield | 417,468 | +3.0% |
| Sacramento | 535,798 | +1.9% |
| San Diego | 1,404,452 | +1.4% |
| Fresno | 550,105 | +1.4% |
| Oakland | 443,554 | +0.6% |
| Oxnard | 200,616 | -0.6% |
Oxnard is the only city on this list losing population. Every comparable California city posted growth. That flat-to-declining headcount limits housing demand pressure. It’s one reason prices softened while much of California kept climbing.
Oxnard Housing Market Trends
The 12-month price history reveals a U-shaped pattern — prices fell through autumn, then recovered:
| Month | City Average | Low ZIP | High ZIP |
|---|---|---|---|
| Mar 2025 | $790,264 | $693,918 | $913,473 |
| Apr 2025 | $788,860 | $692,964 | $910,368 |
| May 2025 | $787,070 | $691,677 | $906,589 |
| Jun 2025 | $785,581 | $691,194 | $903,285 |
| Jul 2025 | $783,861 | $690,518 | $899,795 |
| Aug 2025 | $782,457 | $690,351 | $896,250 |
| Sep 2025 | $781,165 | $690,176 | $892,524 |
| Oct 2025 | $781,084 | $690,851 | $890,074 |
| Nov 2025 | $781,711 | $691,902 | $888,749 |
| Dec 2025 | $783,433 | $693,910 | $888,865 |
| Jan 2026 | $784,450 | $695,353 | $888,989 |
| Feb 2026 | $785,175 | $696,040 | $889,616 |
From the March 2025 peak of $790,264 to the October 2025 low of $781,084, the city average dropped $9,180. Since then, prices have recovered about $4,091 — clawing back roughly 45% of that decline.
The most expensive ZIP dropped from $913,473 to $889,616 over twelve months, a $23,857 decline. Meanwhile, the most affordable ZIP barely moved: $693,918 down to $696,040 — actually rising $2,122. The affordable end is holding up better than the high end.
Is Oxnard a Good Place to Buy in 2026?
The data paints a mixed picture.
On the plus side: prices are below their 2025 peak, and the year-over-year decline of 0.6% gives buyers more negotiating room than they had a year ago. The most affordable ZIP (93033) sits under $700,000, which is relatively accessible for Ventura County.
Working against buyers: monthly ownership costs still far exceed rent. A $1,200-per-month gap is hard to justify unless you’re planning to stay long-term and betting on appreciation. With prices essentially flat, that bet hasn’t paid off recently.
Population decline is a concern. Cities that lose residents tend to see slower price growth over time. Oxnard’s 2024 rebound is encouraging, but one year doesn’t reverse a four-year trend.
If you’re a buyer looking in the $700K range, 93033 offers the best entry point. If you’re flexible on timing, waiting through spring 2026 to see whether the recent uptick continues — or stalls — is a reasonable strategy.
Oxnard Housing Market Outlook for 2026-2027
The three-month trend from December 2025 to February 2026 shows steady but slow gains: $783,433 → $784,450 → $785,175. That’s a pace of roughly $870 per month.
If the current pace continues through summer 2026, the city-wide median could approach $790,000 again by mid-year. But that assumes the seasonal spring bump materializes. In 2025, prices peaked in March and fell through October — the same pattern could repeat.
The high-end ZIP codes are recovering more slowly than the affordable ones. That uneven recovery suggests the market is being supported from the bottom, not pulled up by luxury demand.
Expect modest gains through spring, with risk of another softening in late 2026. A sideways market — neither crashing nor surging — is the most likely path for the next 12 months.
Similar Markets in CA
If you’re house hunting in California, these cities offer useful comparisons to Oxnard:
- Los Angeles — The closest major metro, with a much wider price range and deeper inventory.
- Bakersfield — Significantly more affordable than Oxnard and growing at 3.0% — the fastest among comparable cities.
- Riverside — Another Inland Empire option for buyers priced out of coastal Ventura County.
- San Diego — Higher prices but stronger population growth at 1.4%, which supports long-term demand.
- Fresno — Central Valley pricing with a growing population, a strong contrast to Oxnard’s flat trajectory.
Frequently Asked Questions
What is the average home price in Oxnard?
The average home price in Oxnard is $785,175 as of February 2026. That figure represents the city-wide median across four tracked ZIP codes, where values range from $696,040 in 93033 to $889,616 in 93035.
Are home prices going up or down in Oxnard?
Prices are down 0.6% compared to one year ago. The market hit a low point of $781,084 in October 2025 and has since recovered to $785,175 — a modest upward trend over the last four months.
Is it cheaper to rent or buy in Oxnard?
Renting is cheaper by roughly $1,200 per month. Average rent across the city runs about $2,970, while a mortgage on the median-priced home costs approximately $4,178 per month in principal and interest with 20% down at 7%.
What is the most affordable neighborhood in Oxnard?
ZIP code 93033 is the most affordable, with a median home value of $696,040. Rent there averages $2,658 per month, also the lowest in the city. It’s the only Oxnard ZIP priced below $700,000.
Is Oxnard growing or shrinking?
Oxnard is slightly shrinking. The population fell from 201,908 in 2020 to 200,616 in 2024, a 0.6% decline. There was a small rebound between 2023 and 2024, but the overall four-year trend is negative.
Methodology
Home values are based on the Zillow Home Value Index (ZHVI), a smoothed measure of typical home values in the 35th to 65th percentile range. Rent estimates use the Zillow Observed Rent Index (ZORI). Population figures come from the U.S. Census Bureau Population Estimates Program (2020-2024 vintage). All datasets are publicly available. Housing data updated 2026-02-28.