Reno Home Prices: $592K, Down 0.6% — 11 ZIPs Analyzed (2026)
$592,203. That’s what a typical Reno home is worth as of February 2026, and it’s slightly less than a year ago. Prices are down 0.6% year over year, but the 12-month chart shows the slide may be flattening out.
Quick answer: The average home price in Reno, NV is $592,203 as of February 2026, down 0.6% year over year according to Zillow.
Current Home Prices in Reno
Reno’s typical home value sits at $592,203. That’s a small dip from a year ago, but values are still well above what they were five years back. The market has cooled, but it has not crashed.
The spread between Reno’s cheapest and most expensive ZIP codes is wide. The lowest typical value is $350,568. The highest is $1,094,689. That’s more than a 3x difference inside the same city.
| Metric | Value |
|---|---|
| Median home value | $592,203 |
| Year-over-year change | -0.6% |
| Lowest ZIP value | $350,568 |
| Highest ZIP value | $1,094,689 |
| ZIP codes tracked | 11 |
| Data through | February 2026 |
The small drop tells you Reno is no longer in the price sprint it ran through 2020 and 2021. Buyers have more room to negotiate than they did two years ago. Sellers who priced for the old market are sitting longer.
A 0.6% drop also means this isn’t a fire sale. If you bought near the peak in 2022, you are likely close to flat. If you bought in the last 12 months, your equity probably did not move much.
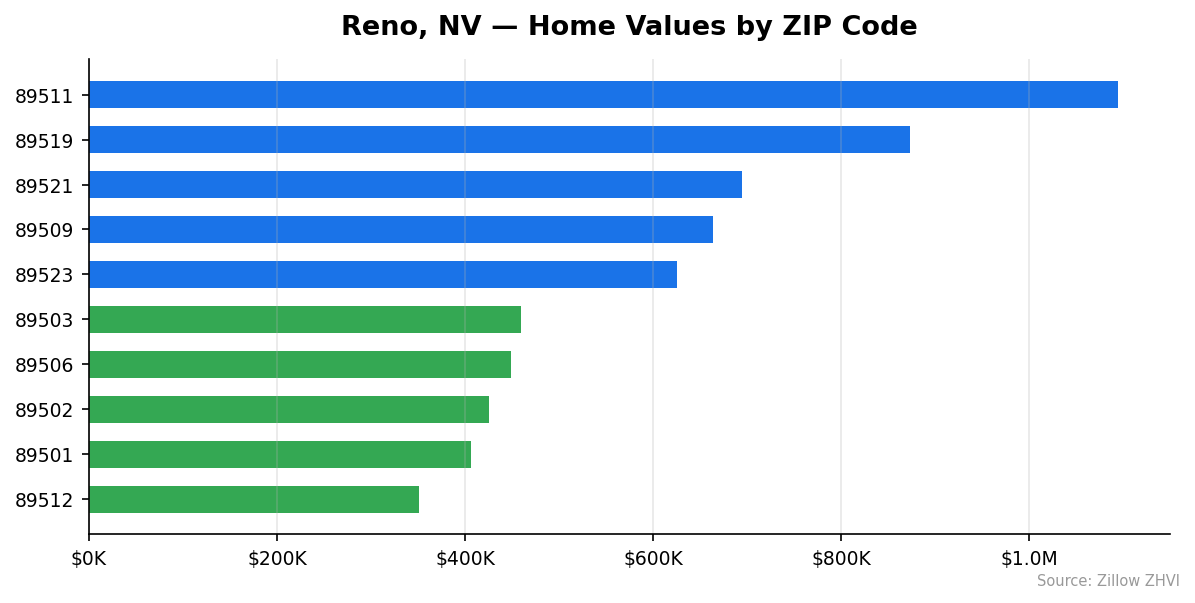
Reno Home Prices by Neighborhood
Reno splits cleanly into two halves. The south and southwest ZIPs sit above $600,000. The downtown and northeast ZIPs sit closer to $400,000. The data shows almost no overlap.
| ZIP | Typical Home Value | Typical Rent |
|---|---|---|
| 89511 | $1,094,689 | $1,969 |
| 89519 | $872,795 | $1,873 |
| 89521 | $694,455 | $2,238 |
| 89509 | $663,646 | $1,773 |
| 89523 | $625,474 | $2,067 |
| 89508 | $473,150 | Data not available for this metric. |
| 89503 | $459,186 | $1,893 |
| 89506 | $448,475 | $2,078 |
| 89502 | $425,134 | $1,410 |
| 89501 | $406,658 | $1,413 |
| 89512 | $350,568 | $1,490 |
Most Expensive
- 89511 ($1,094,689): The only ZIP above seven figures. Values run nearly 85% above the city median, putting it in a different bracket from the rest of Reno.
- 89519 ($872,795): Sits about 47% above the city median. Rent here ($1,873) is close to the citywide average, so the price reflects ownership demand, not rent yield.
- 89521 ($694,455): Highest rent in the city at $2,238 a month, and home values are about 17% above the median. Rent and ownership demand both run hot here.
Most Affordable
- 89512 ($350,568): The cheapest ZIP, at 41% below the city median. Rent runs $1,490, which makes it a workable target for buyers and renters watching their budget.
- 89501 ($406,658): Downtown Reno. Home values sit 31% under the median, and rent at $1,413 is among the lowest in the city.
- 89502 ($425,134): Just east of downtown. Values are 28% below the city median, and rent at $1,410 is the lowest in the dataset.
Rent vs Buy in Reno
Renting wins right now in Reno. The math is not close.
Across the 10 ZIPs with rent data, typical rent ranges from $1,410 in 89502 to $2,238 in 89521. Average that out and you land near $1,820 a month.
Now the buy side. At a $592,203 home with 20% down ($118,440), you finance about $473,762. At a 7% rate over 30 years, principal and interest comes to roughly $3,153 a month. Add property tax (Nevada is friendly here, around 0.6%), insurance, and HOA where it applies, and you’re closer to $3,800 a month all in.
| Cost | Rent (city avg) | Buy (median home, 20% down) |
|---|---|---|
| Monthly payment | ~$1,820 | ~$3,800 |
| Upfront cash | First + deposit | $118,440+ |
Buying costs roughly 2x renting on a monthly basis, plus $118,000+ in cash up front. The gap closes only if you stay 7+ years and prices resume climbing. With values down 0.6% over the last year, that bet is no longer automatic.
If you need housing for under three years, rent. If you have the down payment and plan to stay through 2030, buying still pencils out, especially in the cheaper ZIPs where the gap is narrower.
Population Growth and Migration
Reno is gaining people. The city hit 281,714 residents in 2024, up from 264,990 in 2020. That’s 6.3% growth in four years.
| Year | Population |
|---|---|
| 2020 | 264,990 |
| 2021 | 270,060 |
| 2022 | 273,249 |
| 2023 | 276,078 |
| 2024 | 281,714 |
Growth slowed in 2022 and 2023 but accelerated again in 2024, with the city adding more than 5,600 residents in a single year. That single-year jump is bigger than any year since 2020.
How does Reno stack up against the rest of Nevada?
| City | 2024 Population | 4-yr Growth |
|---|---|---|
| Las Vegas | 678,922 | +4.8% |
| Henderson | 350,039 | +9.8% |
| North Las Vegas | 294,034 | +12.6% |
| Reno | 281,714 | +6.3% |
| Sparks | 111,520 | +2.4% |
| Carson City | 58,148 | -0.9% |
Reno is growing faster than Las Vegas but slower than Henderson and North Las Vegas. Sparks, just next door, is barely adding anyone. Carson City is shrinking.
Steady population growth is the floor under Reno’s housing market. Even with prices flat to slightly negative, more people moving in means demand for housing stays firm. That’s why a -0.6% year is a soft landing, not a collapse.
Reno Housing Market Trends
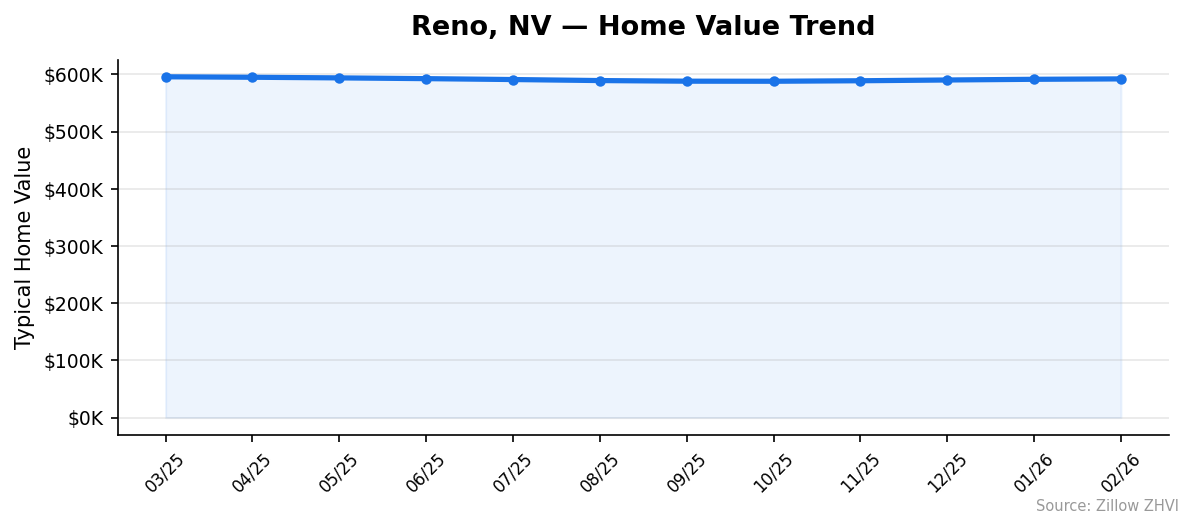
The 12-month chart tells a story of a market that peaked, dropped, and stabilized.
| Month | Median Value |
|---|---|
| March 2025 | $595,869 |
| April 2025 | $595,057 |
| May 2025 | $593,956 |
| June 2025 | $592,624 |
| July 2025 | $591,061 |
| August 2025 | $589,266 |
| September 2025 | $588,186 |
| October 2025 | $588,067 |
| November 2025 | $588,935 |
| December 2025 | $590,269 |
| January 2026 | $591,483 |
| February 2026 | $592,203 |
Values fell every month from March 2025 through October 2025, sliding from $595,869 to $588,067. That’s a $7,802 drop, or about -1.3% across seven months.
Then the bottom held. November ticked up. December and January followed. By February 2026, values had climbed back to $592,203, recovering more than half the loss.
The takeaway: Reno spent most of 2025 cooling, but the last four data points all moved up. The market is not falling anymore. Whether it keeps rising depends on rates and inventory in the spring buying season.
Is Reno a Good Place to Buy in 2026?
It depends on your timeline and which ZIP you’re shopping.
For a long-hold buyer (7+ years) with cash for a 20% down payment, Reno makes sense. The city is growing 6.3% over four years, the price slide has stopped, and you’re not buying at a peak.
For a short-term buyer (under 3 years), the math doesn’t work right now. Rent costs about half of a typical mortgage payment. Prices fell 0.6% over the last year, so you cannot count on appreciation to bail you out at sale time.
For ZIP-specific buys, the cheapest neighborhoods (89512, 89501, 89502) offer the best entry price and a smaller rent-vs-buy gap. The most expensive ZIPs (89511, 89519) are where the slowdown hit hardest in dollar terms.
The market right now favors patient buyers with cash. Sellers no longer set the rules, but they aren’t desperate either. Expect negotiation, not bidding wars.
Reno Housing Market Outlook for 2026-2027
The 3-month trend points up. From November 2025 to February 2026, the median rose from $588,935 to $592,203 — a gain of $3,268, or about 0.6%.
If the current pace continues, Reno could erase the year-over-year decline by mid-2026. That would put values back around $595,000 to $597,000 by summer.
The risk to that path is rates. The recent uptick lined up with a slight easing in mortgage rates. If rates climb again, expect the recovery to stall and prices to drift sideways instead of up.
The longer-term floor looks solid. Population growth of 6.3% over four years and a steady inflow in 2024 keep demand under the market. A repeat of the 2022 price surge is unlikely without a sharp drop in rates, but a slow-grind recovery through 2027 is the base case the data supports.
Similar Markets in NV
- Sparks — Reno’s neighbor, a natural comparison if you want the same metro at a different price point.
- Carson City — Smaller, with a shrinking population, for buyers who want to step outside the Reno-Sparks core.
- Las Vegas — The state’s biggest market, useful for buyers weighing northern vs southern Nevada.
- Henderson — Faster-growing southern Nevada suburb, often compared to Reno’s higher-end ZIPs.
- North Las Vegas — The fastest-growing city in the state at 12.6% over four years.
Frequently Asked Questions
What is the average home price in Reno?
The average home price in Reno, NV is $592,203 as of February 2026. That figure is the typical home value across 11 Reno ZIP codes, ranging from $350,568 in 89512 to $1,094,689 in 89511.
Are home prices going up or down in Reno?
Prices are down 0.6% over the last 12 months. The decline ran from March through October 2025, then reversed. Values have risen four months in a row to reach $592,203 in February 2026.
Is it cheaper to rent or buy in Reno?
Renting is cheaper by a wide margin. Typical rent across Reno ZIPs averages about $1,820 a month, while a mortgage on the median $592K home runs close to $3,800 a month with 20% down at current rates. The buy case improves only if you plan to stay 7+ years.
What is the most affordable neighborhood in Reno?
ZIP 89512 is the cheapest at $350,568, which is 41% below the city median. The next two most affordable are 89501 ($406,658) downtown and 89502 ($425,134) just east of downtown. All three also have rents under $1,500 a month.
Methodology
Home values are based on the Zillow Home Value Index (ZHVI), a smoothed measure of typical home values in the 35th to 65th percentile range. Rent estimates use the Zillow Observed Rent Index (ZORI). Population figures come from the U.S. Census Bureau Population Estimates Program (2020-2024 vintage). All datasets are publicly available. Housing data updated 2026-02-28.