Henderson Home Prices: $483K, Down 1.9% — 8 ZIPs Analyzed (2026)
$483,117. That’s what a typical home costs in Henderson, NV right now. A year ago, you would have paid about $9,300 more. Prices are sliding — slowly, but the direction is clear.
Quick answer: The average home price in Henderson, NV is $483,117 as of February 2026, down 1.9% year over year according to Zillow.
Current Home Prices in Henderson
Henderson sits in the Las Vegas-Henderson-Paradise metro area, and its prices run well above the metro’s lower end. Here’s where things stand:
| Metric | Value |
|---|---|
| Median home price | $483,117 |
| Year-over-year change | -1.9% |
| Lowest ZIP median | $402,994 |
| Highest ZIP median | $602,142 |
| Number of ZIPs tracked | 8 |
| Data as of | February 2026 |
That 1.9% annual drop works out to roughly $9,400 in lost value on the median home. Not a crash — more of a slow leak. The spread between the cheapest and most expensive ZIP codes is nearly $200,000, so where you buy matters as much as when.
Henderson’s price range tells you this isn’t a one-flavor market. You can get in under $410K on the low end or spend north of $600K in the priciest neighborhoods. The gap between those extremes has stayed fairly stable over the past year, which means the decline is hitting most areas at a similar pace rather than concentrating in one pocket.
Henderson Home Prices by Neighborhood
All eight Henderson ZIP codes show meaningful price variation. Here’s every ZIP, ranked from most to least expensive:
| ZIP Code | Median Home Value | Monthly Rent |
|---|---|---|
| 89052 | $602,142 | $1,880 |
| 89044 | $535,385 | $2,119 |
| 89012 | $525,447 | $1,958 |
| 89011 | $470,111 | $1,807 |
| 89074 | $463,272 | $1,764 |
| 89002 | $462,382 | $2,036 |
| 89015 | $403,204 | $1,797 |
| 89014 | $402,994 | $1,451 |
Most Expensive ZIPs
89052 leads Henderson at $602,142 — a full 25% above the city median — yet its rent of $1,880 is not the highest in the city, making it relatively better value for owners versus renters. 89044 comes in at $535,385 with the highest rent in Henderson at $2,119 per month. 89012 rounds out the top three at $525,447 with rent near $1,958.
Most Affordable ZIPs
89014 is the cheapest entry point in Henderson at $402,994, and it also has the lowest rent at $1,451 — a rare case where both buying and renting are the most affordable in the same ZIP. 89015 is nearly identical on home values at $403,204 but charges $346 more per month in rent. 89002 comes in at $462,382 for home values but has surprisingly high rent at $2,036, the second-highest in the city.
Rent vs Buy in Henderson
Rent data is available for all eight Henderson ZIPs, and the math leans toward renting in most cases.
The citywide average rent runs roughly $1,852 per month. A mortgage on the $483,117 median home — assuming 20% down, a 7% rate, and a 30-year term — puts your principal and interest payment around $2,570. Add property taxes and insurance and you’re looking at $3,000 or more.
That’s a gap of over $1,100 per month compared to renting.
| Scenario | Monthly Cost |
|---|---|
| Median rent (citywide avg) | ~$1,852 |
| Mortgage P&I (20% down, 7%) | ~$2,570 |
| Estimated total with taxes/insurance | ~$3,000+ |
Even in the cheapest ZIP (89014), where rent is $1,451, buying a $403K home still costs more per month. The rent-to-buy gap narrows in 89044, where $2,119 rent is closer to the carrying cost of a $535K home, but buying still costs more on a monthly basis.
The breakeven depends on how long you stay and whether prices recover. With values dropping 1.9% per year, short-term buyers are paying more and losing equity.
Population Growth and Migration
Henderson added over 31,000 residents in four years. The city hit 350,039 people in 2024, up 9.8% from 318,660 in 2020.
| Year | Population |
|---|---|
| 2020 | 318,660 |
| 2021 | 322,079 |
| 2022 | 330,645 |
| 2023 | 339,280 |
| 2024 | 350,039 |
Growth has been consistent — roughly 8,000 new residents per year. That pace hasn’t slowed.
How does Henderson compare to other Nevada cities?
| City | 2024 Population | 4-Year Growth |
|---|---|---|
| Las Vegas | 678,922 | 4.8% |
| Henderson | 350,039 | 9.8% |
| North Las Vegas | 294,034 | 12.6% |
| Reno | 281,714 | 6.3% |
| Sparks | 111,520 | 2.4% |
| Carson City | 58,148 | -0.9% |
Only North Las Vegas is growing faster. Henderson is outpacing Las Vegas proper by a factor of two on percentage growth. That population pressure should put a floor under housing demand, even as prices soften. More people means more buyers and more renters competing for housing stock.
Henderson Housing Market Trends
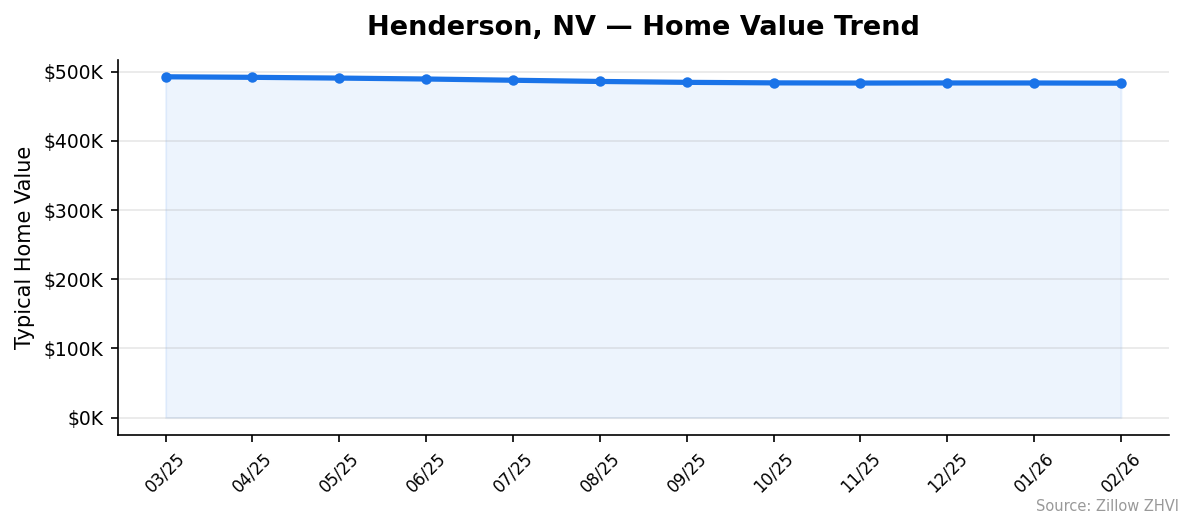
Here’s the 12-month price trajectory, month by month:
| Month | Median Price | Low | High |
|---|---|---|---|
| Mar 2025 | $492,368 | $410,922 | $608,510 |
| Apr 2025 | $491,604 | $409,761 | $607,607 |
| May 2025 | $490,502 | $408,398 | $606,505 |
| Jun 2025 | $489,159 | $406,937 | $605,378 |
| Jul 2025 | $487,380 | $405,297 | $603,833 |
| Aug 2025 | $485,636 | $403,978 | $602,383 |
| Sep 2025 | $484,328 | $403,375 | $601,167 |
| Oct 2025 | $483,584 | $403,033 | $600,845 |
| Nov 2025 | $483,318 | $403,115 | $601,016 |
| Dec 2025 | $483,464 | $403,286 | $601,860 |
| Jan 2026 | $483,414 | $403,412 | $602,183 |
| Feb 2026 | $483,117 | $402,994 | $602,142 |
The decline accelerated from March through September 2025, dropping about $8,000 in six months. Then it flattened. From October 2025 to February 2026, the median barely moved — losing just $467 over five months.
That flattening is worth watching. The market bled out its steepest losses in mid-2025 and has since stabilized near the $483K level. Both the floor (low ZIP) and the ceiling (high ZIP) have also held steady since autumn.
Is Henderson a Good Place to Buy in 2026?
The numbers point to a market finding its bottom. Prices are still technically falling, but at a pace of less than $100 per month since October. That’s statistical noise, not a meaningful decline.
Buyers have more bargaining power than they did in 2024. The 1.9% YoY drop means sellers are more likely to negotiate. The spread between the cheapest ZIPs ($403K) and most expensive ($602K) gives you options at multiple price points.
The risk is clear: you’re buying into a flat-to-declining market with mortgage rates that make renting cheaper month-to-month. If you plan to stay five-plus years and want to lock in a price near what looks like a floor, the data supports that bet. If you’re looking at a two-year flip, the trend doesn’t support it.
Henderson’s 9.8% population growth is the strongest argument for long-term demand. People keep moving here. That matters.
Henderson Housing Market Outlook for 2026-2027
The last five months show prices hovering in a tight band between $483,100 and $483,600. If that pattern holds, Henderson is looking at a flat market through mid-2026 rather than further declines.
The steeper drops from spring and summer 2025 have clearly run their course. The 3-month trend from December to February shows movement of less than $350 total — essentially sideways.
If the current pace continues, expect the median to stay in the $480K to $485K range through the remainder of 2026. A return to the $490K+ levels of early 2025 would require a shift in mortgage rates or a surge in demand beyond what population growth alone provides. Neither is visible in the current data.
Similar Markets in NV
If you’re shopping Henderson, these Nevada cities are worth comparing:
- Las Vegas — The larger neighbor with a 678K population and slower 4.8% growth; likely offers more inventory across a wider price range.
- North Las Vegas — Growing even faster than Henderson at 12.6%, which may mean more new construction and different price dynamics.
- Reno — A smaller market in northern Nevada with 6.3% growth; offers a different lifestyle and climate.
- Sparks — Adjacent to Reno with modest 2.4% growth; could be a value alternative for those open to relocating within the state.
- Carson City — The only Nevada city on this list losing population, down 0.9%. That could mean less competition for buyers.
Frequently Asked Questions
What is the average home price in Henderson?
The average home price in Henderson is $483,117 as of February 2026. Prices range from about $403,000 in ZIP codes 89014 and 89015 to over $602,000 in 89052. The citywide number has dropped from roughly $492,000 a year ago.
Are home prices going up or down in Henderson?
Down. Henderson home prices fell 1.9% year over year through February 2026. Most of that decline happened between March and September 2025. Since October, prices have been essentially flat, losing less than $500 over five months.
Is it cheaper to rent or buy in Henderson?
Renting is cheaper in every Henderson ZIP code right now. The average monthly rent across the city is approximately $1,852, while a mortgage on the median-priced home runs about $2,570 per month in principal and interest alone. With taxes and insurance, the gap widens further.
What is the most affordable neighborhood in Henderson?
ZIP code 89014 has the lowest median home value at $402,994. It also has the cheapest rent in the city at $1,451 per month. ZIP 89015 is nearly identical on home prices at $403,204 but charges more in rent.
Methodology
Home values are based on the Zillow Home Value Index (ZHVI), a smoothed measure of typical home values in the 35th to 65th percentile range. Rent estimates use the Zillow Observed Rent Index (ZORI). Population figures come from the U.S. Census Bureau Population Estimates Program (2020-2024 vintage). All datasets are publicly available. Housing data updated 2026-02-28.