Sparks Home Prices: $528K, Down 0.2% — 4 ZIPs Analyzed (2026)
$527,534. That’s what a typical home in Sparks, NV is worth as of February 2026. Prices are down 0.2% from a year ago — essentially flat after a mild slide through the summer and a small rebound since November.
Quick answer: The average home price in Sparks, NV is $527,534 as of February 2026, down 0.2% year over year according to Zillow.
Current Home Prices in Sparks
The Sparks market sits in a holding pattern. The citywide median is $527,534, and the 12-month change is -0.2%. That’s about as close to flat as a housing market gets.
Within the city, values span a wide band. The cheapest ZIP averages $390,312. The most expensive averages $688,718. That’s a $298,406 spread between neighborhoods inside the same city limits.
| Metric | Value |
|---|---|
| Median home value | $527,534 |
| Year-over-year change | -0.2% |
| Cheapest ZIP average | $390,312 |
| Most expensive ZIP average | $688,718 |
| ZIP codes tracked | 4 |
| Metro area | Reno, NV |
| Data through | February 2026 |
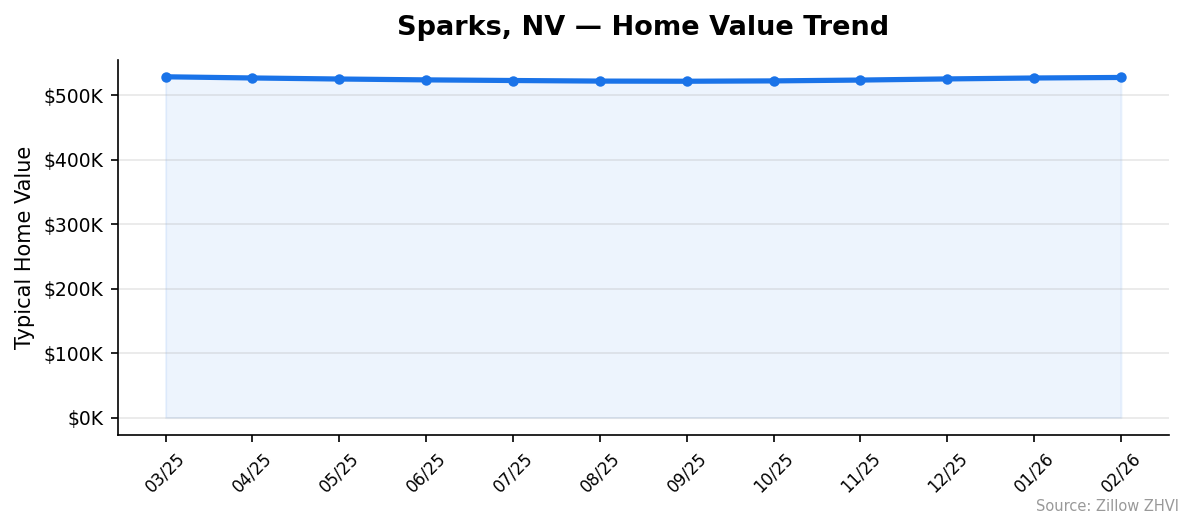
A year ago the typical Sparks home was worth $528,574. It dipped to a low of $521,670 in September 2025, then crept back up over the fall and winter. The current $527,534 reading is the highest since April 2025.
If you’re buying, the story is patience paid off for most of 2025 — but the window for falling prices has closed. If you’re selling, you’re not getting more than you would have a year ago, but you’re not getting much less either.
Sparks Home Prices by Neighborhood
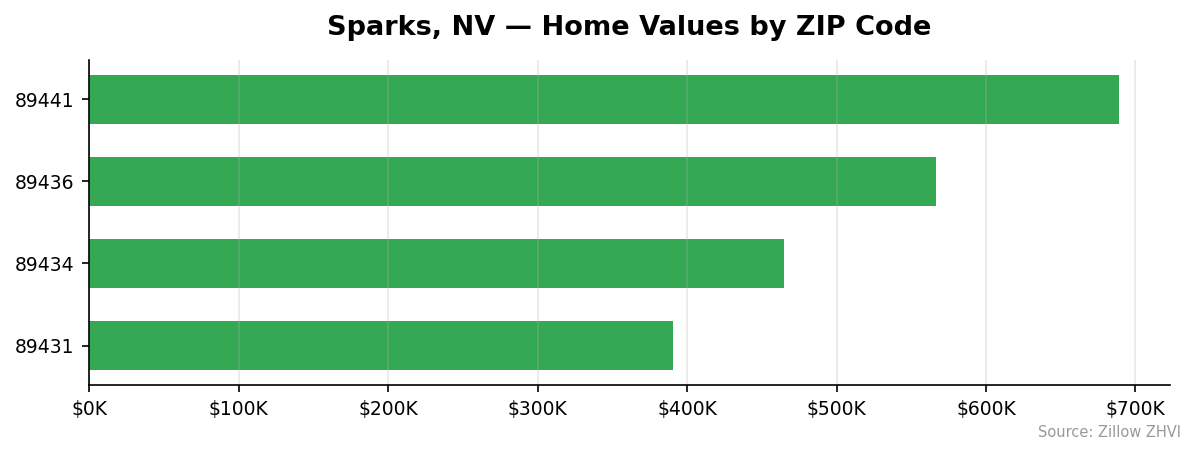
Four ZIP codes make up the Sparks market, and the gap between them is wide.
| ZIP Code | Average Home Value | vs City Median |
|---|---|---|
| 89441 | $688,718 | +30.6% |
| 89436 | $566,308 | +7.3% |
| 89434 | $464,798 | -11.9% |
| 89431 | $390,312 | -26.0% |
Most Expensive
89441 tops the list at $688,718 — more than $161,000 above the city median and the only ZIP in Sparks above the $600K mark. 89436 is the second-priciest at $566,308, roughly 7% above the citywide average, with rents around $2,114. 89434 comes in third at $464,798, sitting below the city median but still well above the floor.
Most Affordable
89431 is by far the cheapest ZIP at $390,312 — about $137,000 below the city average, with rents of $1,659. 89434 is next at $464,798, a middle-tier option with rents of $1,962. 89436 rounds out the affordable-to-midrange picture at $566,308, though it’s already above the median.
Rent vs Buy in Sparks
Rent data is available for three of the four Sparks ZIPs. The spread: $1,659 in 89431 up to $2,114 in 89436, with 89434 at $1,962.
| ZIP | Typical Rent | Typical Home Value |
|---|---|---|
| 89431 | $1,659 | $390,312 |
| 89434 | $1,962 | $464,798 |
| 89436 | $2,114 | $566,308 |
Now the math. A $527,534 home with 20% down leaves a $422,027 loan. At 7% for 30 years, principal and interest alone runs about $2,808 a month — before property taxes, insurance, or HOA dues. Add those in and you’re near $3,400.
Rent runs $1,659 to $2,114. You’re looking at roughly $1,300 to $1,700 a month more to own than rent in Sparks right now.
That gap shrinks if you have a larger down payment or if rates fall. It also shrinks over time as rent rises and mortgage payments stay flat. But on a pure monthly-cost basis today, renting wins by a clear margin.
Population Growth and Migration
Sparks added 2,634 residents between 2020 and 2024. That’s a 2.4% gain over four years — positive, but modest.
| Year | Population |
|---|---|
| 2020 | 108,886 |
| 2021 | 109,703 |
| 2022 | 109,163 |
| 2023 | 110,771 |
| 2024 | 111,520 |
Growth wasn’t linear. The city lost residents in 2022 before gaining them back in 2023 and 2024. The 2024 count of 111,520 is the highest on record in this window.
Compared to the rest of Nevada, Sparks is a slower grower.
| City | 2024 Population | 4-Year Growth |
|---|---|---|
| North Las Vegas | 294,034 | +12.6% |
| Henderson | 350,039 | +9.8% |
| Reno | 281,714 | +6.3% |
| Las Vegas | 678,922 | +4.8% |
| Sparks | 111,520 | +2.4% |
| Carson City | 58,148 | -0.9% |
Southern Nevada cities are pulling in residents faster than the Reno metro. Sparks grew less than half as fast as neighboring Reno. For housing demand, that means less upward pressure from new arrivals than you’d see in North Las Vegas or Henderson — which helps explain why Sparks prices are flat while population-heavy markets continue to push upward.
Sparks Housing Market Trends
Here’s the 12-month price path.
| Month | Average Value |
|---|---|
| Feb 2026 | $527,534 |
| Jan 2026 | $526,706 |
| Dec 2025 | $525,267 |
| Nov 2025 | $523,506 |
| Oct 2025 | $522,201 |
| Sep 2025 | $521,670 |
| Aug 2025 | $521,899 |
| Jul 2025 | $522,807 |
| Jun 2025 | $523,782 |
| May 2025 | $525,126 |
| Apr 2025 | $526,750 |
| Mar 2025 | $528,574 |
Values peaked in March 2025 at $528,574, declined for six straight months to a September low of $521,670, then climbed back five months in a row. The bottom-to-now gain is $5,864, or about 1.1%.
The trajectory looks like a shallow U. Winter is usually the soft season for housing, so a winter rally is worth watching. If the pattern holds into spring, the YoY number could flip from negative to positive within the next quarter.
Is Sparks a Good Place to Buy in 2026?
The data points to a balanced market leaning slightly toward buyers.
Prices are essentially flat year over year. The six-month decline from March through September 2025 gave buyers more room to negotiate than they had a year earlier. That edge is shrinking as prices have climbed for five consecutive months.
The rent-vs-buy gap is wide. Renting saves you $1,300 or more a month at current rates, which means the case for buying rests on long-term wealth building, not monthly cash flow.
Sparks growth is slow compared to Henderson or North Las Vegas, but it’s still positive. That’s enough demand to keep prices stable, not enough to spark bidding wars.
If you need to move, the market is cooperative. If you’re timing the bottom, you likely missed it by a few months.
Sparks Housing Market Outlook for 2026-2027
The 3-month trend is up. November through February added $4,028 to the typical home value, or about 0.8%.
If the current pace continues, Sparks prices would cross back above last March’s $528,574 peak sometime in the next 1-2 months and turn the YoY number positive by summer. That’s an extrapolation, not a guarantee — seasonal demand tends to weaken in late summer, and rate moves could change the picture fast.
The underlying setup is stable: flat-to-slow population growth, a wide ZIP-to-ZIP price range, and no signs of either a crash or a boom. Expect single-digit annual moves in either direction through 2026 and into 2027 unless rates shift materially.
Similar Markets in NV
- Reno — Sparks’ larger neighbor in the same metro, useful for cross-shopping buyers who want more inventory.
- Carson City — a short drive south and the only Nevada city on this list losing residents.
- Henderson — southern Nevada’s high-growth suburb, a contrast to Sparks’ slower pace.
- Las Vegas — the state’s biggest market, worth comparing if job location is flexible.
- North Las Vegas — Nevada’s fastest-growing major city at 12.6% over four years.
Frequently Asked Questions
What is the average home price in Sparks?
The average home price in Sparks, NV is $527,534 as of February 2026. That figure reflects the Zillow Home Value Index across the four ZIP codes in the city, with individual neighborhoods ranging from $390,312 to $688,718.
Are home prices going up or down in Sparks?
Prices are down 0.2% year over year — essentially flat. The market bottomed at $521,670 in September 2025 and has climbed five straight months to reach $527,534 in February 2026.
Is it cheaper to rent or buy in Sparks?
Renting is cheaper. Typical rents run from $1,659 to $2,114 depending on the ZIP, while a mortgage on the $527,534 median home with 20% down comes to roughly $2,800 in principal and interest alone at 7% — closer to $3,400 once you add taxes and insurance.
What is the most affordable neighborhood in Sparks?
ZIP 89431 is the cheapest at an average of $390,312. That’s 26% below the city median and the only Sparks ZIP under $400,000.
Methodology
Home values are based on the Zillow Home Value Index (ZHVI), a smoothed measure of typical home values in the 35th to 65th percentile range. Rent estimates use the Zillow Observed Rent Index (ZORI). Population figures come from the U.S. Census Bureau Population Estimates Program (2020-2024 vintage). All datasets are publicly available. Housing data updated 2026-02-28.