Rockville Home Prices: $593K, Down 1.1% — 4 ZIPs Analyzed (2026)
$593,429. That’s what a typical home costs in Rockville, MD right now. The number is down 1.1% from a year ago — a small dip, but a dip nonetheless in a city where prices touched nearly $694K just ten months back.
Quick answer: The average home price in Rockville, MD is $593,429 as of February 2026, down 1.1% year over year according to Zillow.
Current Home Prices in Rockville
Rockville sits in the Washington-Arlington-Alexandria metro, one of the most expensive housing markets in the country. Even so, the city has been cooling off.
| Metric | Value |
|---|---|
| Median Home Price | $593,429 |
| Year-over-Year Change | -1.1% |
| Lowest ZIP Median | $528,475 |
| Highest ZIP Median | $686,794 |
| Price Range (Spread) | $158,319 |
| ZIP Codes Tracked | 4 |
| Data as of | February 2026 |
The 1.1% decline may not sound like much, but it translates to roughly $6,600 in lost value on the median home over 12 months. For a market that was climbing steadily through 2024, this is a shift worth watching.
Rockville’s price range tells you a lot. The gap between the cheapest and most expensive ZIP codes is over $158,000. That means your experience of the Rockville market depends entirely on which neighborhood you’re looking at. A buyer priced out of 20850 might find something workable in 20852 — same city, very different price tag.
The current median puts Rockville well above the national average, which hovers near $360,000. You’re paying a premium for proximity to D.C., access to the Metro, and Montgomery County schools.
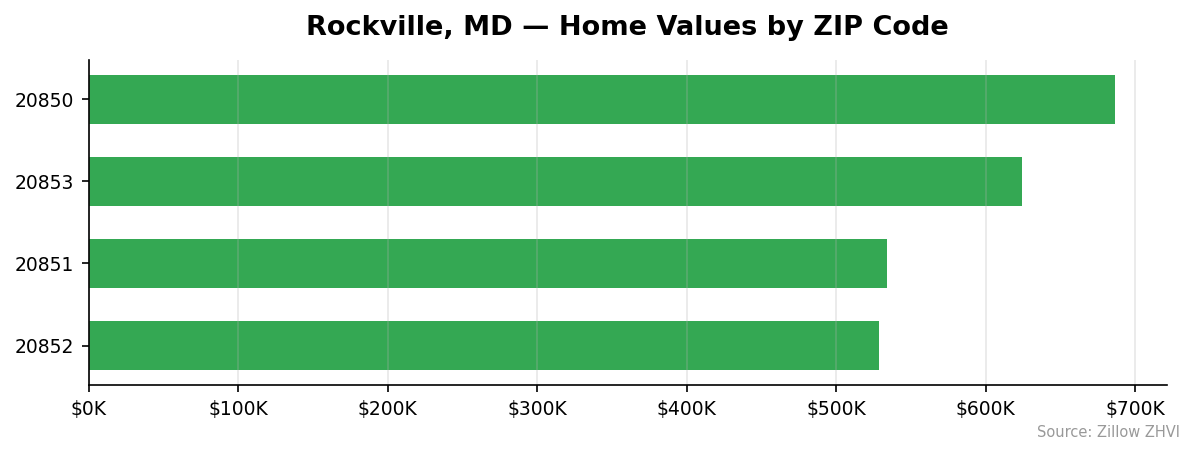
Rockville Home Prices by Neighborhood
All four Rockville ZIP codes show meaningful price differences. Here’s the full breakdown:
| ZIP Code | Median Home Value | Monthly Rent | vs. City Median |
|---|---|---|---|
| 20850 | $686,794 | $2,336 | +$93,365 |
| 20853 | $624,523 | $3,175 | +$31,094 |
| 20851 | $533,922 | $2,737 | -$59,507 |
| 20852 | $528,475 | $2,235 | -$64,954 |
Most Expensive
20850 leads at $686,794, nearly $160,000 above the cheapest ZIP — yet its rent of $2,336/month is actually the second-lowest in the city, which signals strong owner-occupancy and high equity.
20853 comes in at $624,523 with the highest rent in Rockville at $3,175/month, suggesting strong rental demand and possibly newer housing stock.
Most Affordable
20852 is the entry point to Rockville homeownership at $528,475. It also has the lowest rent at $2,235/month, making it the most budget-friendly ZIP on both sides of the rent-or-buy equation.
20851 at $533,922 is only $5,400 more than 20852 but carries noticeably higher rent at $2,737/month. For renters in this ZIP, buying could be worth running the numbers.
Rent vs Buy in Rockville
Renting is cheaper than buying in most parts of Rockville — at least on a pure monthly payment basis.
Here’s the math. The median home at $593,429 with 20% down ($118,686) leaves a $474,743 mortgage. At a 7% rate over 30 years, that’s roughly $3,160/month in principal and interest alone. Add property taxes and insurance and you’re likely above $3,800.
| ZIP Code | Monthly Rent | Est. Mortgage (P&I) | Difference |
|---|---|---|---|
| 20850 | $2,336 | $3,659 | Rent saves $1,323 |
| 20853 | $3,175 | $3,328 | Rent saves $153 |
| 20851 | $2,737 | $2,845 | Rent saves $108 |
| 20852 | $2,235 | $2,816 | Rent saves $581 |
Mortgage estimates assume 20% down, 7% rate, 30-year fixed, principal and interest only.
In every ZIP, renting costs less per month. The gap is widest in 20850, where buying costs over $1,300 more per month than renting. ZIP 20853 is the closest to break-even, with only $153 separating rent from a mortgage payment.
Of course, mortgage payments build equity. Rent payments don’t. But with prices declining 1.1% year over year, equity accumulation is slower than it was two years ago.
Population Growth and Migration
Rockville is growing, but barely.
The city’s population hit 68,417 in 2024, up 1.6% from 67,337 in 2020. That works out to about 1,080 new residents over four years — modest by any measure.
| Year | Population | Change |
|---|---|---|
| 2020 | 67,337 | — |
| 2021 | 67,219 | -118 |
| 2022 | 67,462 | +243 |
| 2023 | 67,966 | +504 |
| 2024 | 68,417 | +451 |
The city actually lost residents in 2021 before recovering. Growth has picked up since 2022, but the pace is flattening.
How does Rockville compare to its neighbors?
| City | 2024 Population | 4-Year Growth |
|---|---|---|
| Frederick | 89,537 | +14.2% |
| Gaithersburg | 70,686 | +1.7% |
| Rockville | 68,417 | +1.6% |
| Bowie | 58,421 | +0.3% |
| Baltimore | 568,271 | -2.6% |
Frederick is the standout, growing over 14% in four years. Gaithersburg and Rockville are nearly identical at 1.7% and 1.6%. Baltimore continues to shrink.
For housing demand, Rockville’s slow growth means no population-driven price surge. The city isn’t losing people, but it’s not attracting them fast enough to put upward pressure on prices either.
Rockville Housing Market Trends
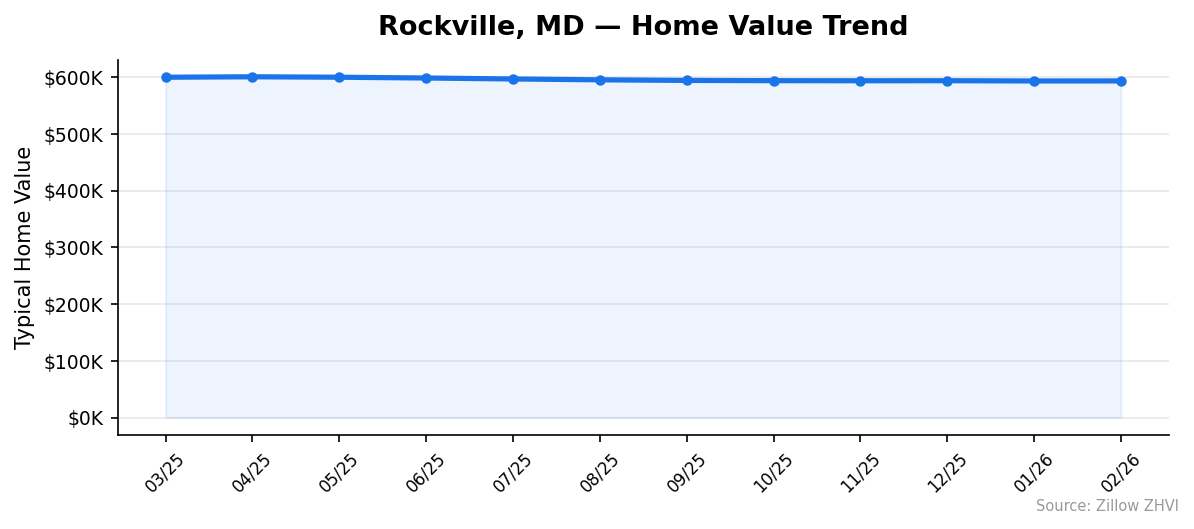
The 12-month trend shows a market that peaked in spring 2025 and has been sliding since.
| Month | Avg. Home Value | Monthly Change |
|---|---|---|
| Feb 2026 | $593,429 | +$53 |
| Jan 2026 | $593,376 | -$443 |
| Dec 2025 | $593,819 | +$68 |
| Nov 2025 | $593,751 | -$146 |
| Oct 2025 | $593,897 | -$444 |
| Sep 2025 | $594,341 | -$1,034 |
| Aug 2025 | $595,375 | -$1,531 |
| Jul 2025 | $596,906 | -$1,673 |
| Jun 2025 | $598,579 | -$1,397 |
| May 2025 | $599,976 | -$753 |
| Apr 2025 | $600,729 | +$773 |
| Mar 2025 | $599,956 | — |
The peak was April 2025 at $600,729. From there, prices dropped every single month through January 2026. The total decline from peak to trough: $7,353, or about 1.2%.
February 2026 showed the first — barely — positive movement in months, with prices ticking up $53. That’s essentially flat. The decline has slowed to a crawl, but there’s no clear reversal yet.
The sharpest monthly drops came in the summer of 2025, when prices fell $1,500-$1,700 per month. By late fall, the declines had shrunk to a few hundred dollars.
Is Rockville a Good Place to Buy in 2026?
The data points to a buyer-friendly window.
Prices are down 1.1% year over year and the monthly trend shows deceleration in the decline. You’re not catching a falling knife — the drops have gotten smaller each month. But you’re also not buying into momentum. Prices are flat.
For buyers, this means less competition and more negotiating power than you’d have had in 2024. Sellers who listed expecting $600K+ are now sitting with a $593K reality.
The rent-vs-buy math still favors renting on a monthly basis, but if you plan to stay 5+ years and rates eventually drop, today’s prices could look reasonable in hindsight.
Rockville’s fundamentals are solid: D.C. proximity, Metro access, stable population. It’s not a speculative market. It’s a market that ran too hot and is correcting.
If you’re a first-time buyer, 20852 and 20851 offer entry points under $535,000. If you have more to spend, 20850 has the highest values but surprisingly reasonable rents, suggesting room for appreciation once the market turns.
Rockville Housing Market Outlook for 2026-2027
The three-month trend from December 2025 through February 2026 shows prices effectively flat — bouncing within a $500 range. The steep monthly declines of mid-2025 are over.
If the current pace continues, expect prices to hover in the $590,000-$595,000 range through summer 2026. The February uptick of $53 is too small to call a reversal, but the bleeding has stopped.
Spring and summer typically bring higher activity and mild price bumps. If that seasonal pattern holds, Rockville could see prices nudge back toward $596,000-$598,000 by August 2026. A return to the $600K+ peak from April 2025 looks unlikely without a meaningful drop in mortgage rates.
The biggest wildcard is interest rates. If rates fall below 6.5%, demand could pick up quickly in a market like Rockville where buyers are sidelined, not absent.
Similar Markets in MD
If you’re exploring Rockville, these nearby Maryland markets are worth comparing:
- Gaithersburg — Rockville’s immediate neighbor with similar pricing and a nearly identical 1.7% population growth rate.
- Silver Spring — Another Montgomery County city closer to D.C., often priced similarly to Rockville.
- Germantown — Further out from D.C. with typically lower prices for buyers willing to trade commute time for savings.
- Frederick — The fastest-growing city in the region at 14.2% population growth, about 45 minutes northwest.
- Bethesda — The upscale neighbor, for buyers with a bigger budget looking inside the Beltway.
Frequently Asked Questions
What is the average home price in Rockville?
The average home price in Rockville, MD is $593,429 as of February 2026. Across the city’s four ZIP codes, prices range from $528,475 in 20852 to $686,794 in 20850. That’s a $158,000 gap within a single city.
Are home prices going up or down in Rockville?
Down. Prices have fallen 1.1% year over year. The decline started in May 2025, following a peak of $600,729 in April 2025. The pace of decline has slowed considerably in recent months, with February 2026 showing essentially flat movement.
Is it cheaper to rent or buy in Rockville?
Renting is cheaper on a monthly basis in every Rockville ZIP code. The average monthly rent across the city is roughly $2,621, while a mortgage on the median home runs about $3,160/month in principal and interest alone. The gap is narrowest in 20853, where rent ($3,175) nearly matches the estimated mortgage payment.
What is the most affordable neighborhood in Rockville?
ZIP code 20852 is the most affordable with a median home value of $528,475 — about $65,000 below the citywide median. It also has the lowest average rent at $2,235/month, making it the most budget-friendly area in Rockville for both renters and buyers.
Methodology
Home values are based on the Zillow Home Value Index (ZHVI), a smoothed measure of typical home values in the 35th to 65th percentile range. Rent estimates use the Zillow Observed Rent Index (ZORI). Population figures come from the U.S. Census Bureau Population Estimates Program (2020-2024 vintage). All datasets are publicly available. Housing data updated 2026-02-28.