Allentown Home Prices: $300K, Up 4.4% — 6 ZIPs Analyzed (2026)
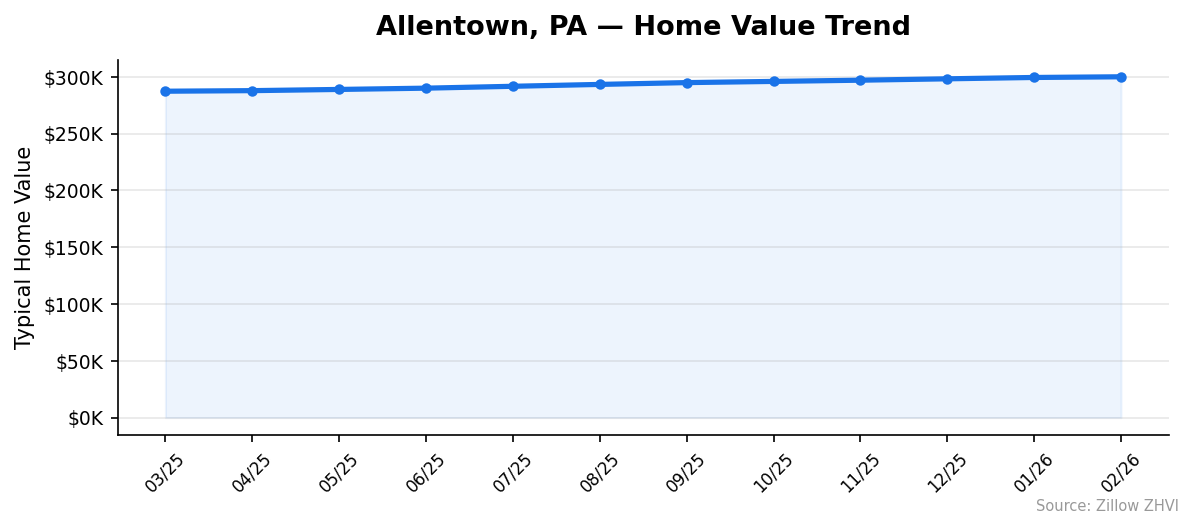
$300,138. That’s what a typical home in Allentown costs right now — and it’s the first time the city’s median has crossed the $300K mark. Prices are up 4.4% year over year, continuing a steady climb that hasn’t paused in 12 months.
Quick answer: The average home price in Allentown, PA is $300,138 as of February 2026, up 4.4% year over year according to Zillow.
Current Home Prices in Allentown
| Metric | Value |
|---|---|
| Median Home Price | $300,138 |
| Year-over-Year Change | +4.4% |
| Lowest ZIP Median | $203,098 |
| Highest ZIP Median | $432,976 |
| ZIP Codes Tracked | 6 |
| Data Through | February 2026 |
The $300K median puts Allentown in a middle tier for Pennsylvania cities. A 4.4% annual gain means a home worth $287,429 in March 2025 added roughly $12,700 in value over the following 12 months.
That pace isn’t explosive, but it’s consistent. Every single month in the past year posted a gain over the prior month. There were no dips, no flat stretches. The floor price across all ZIPs held steady around $203K while the ceiling pushed past $432K.
The spread between the cheapest and most expensive ZIP is $229,878 — a gap wide enough that two buyers shopping in the same city could have completely different experiences.
Allentown Home Prices by Neighborhood
| ZIP Code | Median Home Value | Median Rent |
|---|---|---|
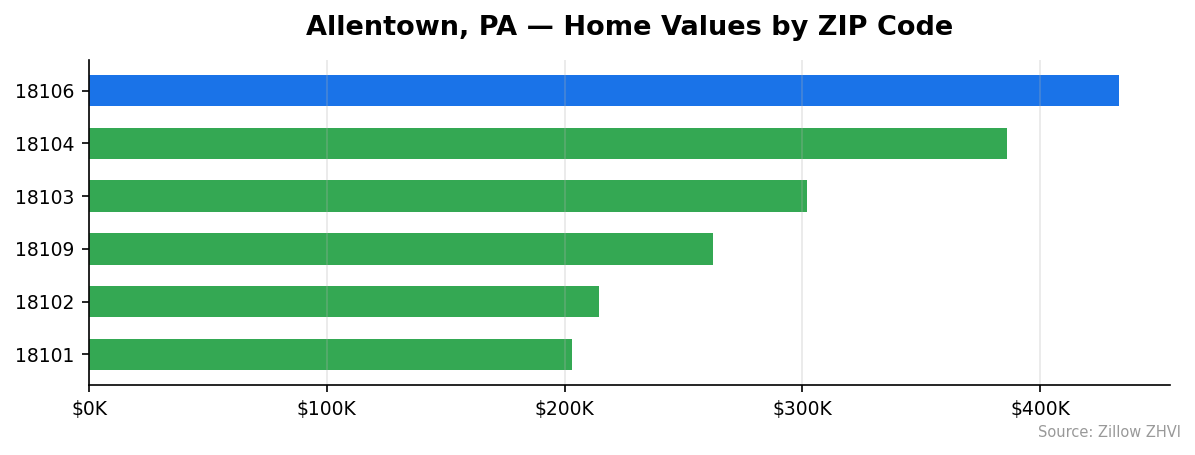
| 18106 | $432,976 | Data not available |
| 18104 | $385,998 | $2,139/mo |
| 18103 | $301,857 | $1,743/mo |
| 18109 | $262,570 | $1,615/mo |
| 18102 | $214,327 | $1,498/mo |
| 18101 | $203,098 | $1,650/mo |
Most Expensive ZIPs
18106 leads the city at $432,976 — 44% above the citywide median. Rent data isn’t available for this ZIP, which suggests a predominantly owner-occupied area.
18104 comes in at $385,998 with rents averaging $2,139 per month, the highest rent of any Allentown ZIP. The combination of high home values and high rents points to strong demand.
18103 sits almost exactly at the city average, at $301,857. Rents here run $1,743, making it a middle-of-the-road option.
Most Affordable ZIPs
18101 is the cheapest place to buy in Allentown at $203,098 — 32% below the city median. Interestingly, rent here is $1,650, which is higher than in 18102 and 18109, suggesting rental demand even in this lower-priced area.
18102 comes in at $214,327 with the city’s lowest rent at $1,498 per month. Both the purchase price and rental cost are the most budget-friendly combination in Allentown.
18109 at $262,570 offers a step up in value while keeping rent moderate at $1,615.
Rent vs Buy in Allentown
Here’s the basic math. A $300,138 home with 20% down ($60,028) leaves a mortgage of $240,110. At a 6.5% rate on a 30-year fixed loan, the monthly principal and interest payment comes to roughly $1,518.
Add property taxes, insurance, and maintenance, and you’re looking at a true monthly cost somewhere between $1,900 and $2,200.
| ZIP | Median Value | Est. Mortgage (P&I) | Median Rent |
|---|---|---|---|
| 18101 | $203,098 | ~$1,027 | $1,650 |
| 18102 | $214,327 | ~$1,084 | $1,498 |
| 18103 | $301,857 | ~$1,527 | $1,743 |
| 18104 | $385,998 | ~$1,953 | $2,139 |
| 18109 | $262,570 | ~$1,328 | $1,615 |
Mortgage estimates assume 20% down, 6.5% rate, 30-year fixed. Does not include taxes, insurance, or maintenance.
The numbers tell different stories depending on where you look. In 18101, renting at $1,650 actually costs more than the estimated mortgage payment of $1,027. That’s one of the few ZIPs where buying looks clearly cheaper on a monthly basis — even before you factor in equity.
In 18104, the math is tighter. A $1,953 mortgage payment versus $2,139 in rent makes buying slightly cheaper month-to-month, but once you add taxes and insurance, the costs are roughly even.
For most buyers, the decision comes down to how long you plan to stay. With prices climbing 4.4% per year, owners are gaining roughly $13,200 in annual equity. Renters capture none of that.
Population Growth and Migration
Allentown’s population reached 127,138 in 2024, up 1.1% from 125,731 in 2020. The growth has been uneven — the city actually lost residents in 2022 before rebounding.
| Year | Population |
|---|---|
| 2020 | 125,731 |
| 2021 | 125,833 |
| 2022 | 125,347 |
| 2023 | 125,919 |
| 2024 | 127,138 |
The 2024 jump of 1,219 residents was the largest single-year gain in this period. That rebound after the 2022 dip suggests the city is attracting new residents again.
How does Allentown compare to its neighbors?
| City | 2024 Population | 4-Year Growth |
|---|---|---|
| Pittsburgh | 307,668 | +1.6% |
| Allentown | 127,138 | +1.1% |
| Reading | 96,000 | +1.1% |
| Bethlehem | 79,453 | +4.9% |
| Harrisburg | 50,649 | +1.1% |
| Lancaster | 58,441 | +0.9% |
Bethlehem stands out at 4.9% growth — nearly five times Allentown’s rate. That neighboring city’s population surge may be pushing some buyers into Allentown as an alternative, which would help explain the steady price increases.
More people means more demand for housing. The 1,219-person gain in 2024 translates to roughly 450-500 new households, assuming average household size. That’s not a flood, but in a city with only six tracked ZIP codes, it adds real pressure.
Allentown Housing Market Trends
The past 12 months show an unbroken climb.
| Month | Average Value | Low (ZIP) | High (ZIP) |
|---|---|---|---|
| Feb 2026 | $300,138 | $203,098 | $432,976 |
| Jan 2026 | $299,540 | $203,567 | $431,583 |
| Dec 2025 | $298,352 | $203,441 | $429,308 |
| Nov 2025 | $297,139 | $203,611 | $426,794 |
| Oct 2025 | $296,068 | $203,925 | $424,579 |
| Sep 2025 | $295,015 | $203,788 | $422,483 |
| Aug 2025 | $293,426 | $202,840 | $420,068 |
| Jul 2025 | $291,777 | $201,299 | $417,827 |
| Jun 2025 | $290,121 | $199,415 | $415,956 |
| May 2025 | $288,999 | $197,310 | $415,013 |
| Apr 2025 | $287,937 | $195,020 | $414,239 |
| Mar 2025 | $287,429 | $193,916 | $413,940 |
Notice something: the low-end ZIPs barely moved. The cheapest ZIP went from $193,916 to $203,098 — a gain of $9,182 or 4.7%. The most expensive ZIP jumped from $413,940 to $432,976 — a gain of $19,036 or 4.6%.
In dollar terms, expensive neighborhoods added twice as much value. But in percentage terms, the gains were nearly identical across the price spectrum. The market is rising evenly.
Monthly gains averaged about $1,060 per month. The pace picked up slightly in the second half, with the Oct-to-Feb stretch adding $4,070 versus $3,448 in the prior four months.
Is Allentown a Good Place to Buy in 2026?
The data leans toward a seller’s market. Twelve consecutive months of price increases, positive population growth, and a 4.4% annual gain all point in the same direction.
For buyers, the entry points are still there. Two ZIPs — 18101 and 18102 — sit below $215K, which is accessible with an FHA loan and minimal down payment. In 18101, buying is cheaper than renting on a monthly basis.
The risk? You’re buying into a market that has climbed steadily with no corrections. If you’re planning to hold for five years or more, the trend supports your purchase. If you need to sell in two years, a market slowdown could leave you flat.
Investors should look at 18101 closely. A $203K purchase price with $1,650 in monthly rent produces a rent-to-price ratio of 0.81% — not stellar, but workable with the right financing.
Allentown Housing Market Outlook for 2026-2027
The 3-month trend from December 2025 through February 2026 shows the average rising by about $600 per month. That’s a slight deceleration from the $700+ monthly gains seen in the summer of 2025.
If the current pace continues, you can expect the citywide median to reach roughly $305K to $310K by the end of 2026. The 12-month trendline has been remarkably straight — no seasonal dips, no stalls.
The biggest wildcard is mortgage rates. The 4.4% annual gain happened during a period of elevated rates. If rates drop, pent-up demand could push prices higher, faster. If rates climb further, the steady gains could flatten.
Population growth supports continued demand, though Allentown’s 1.1% growth rate isn’t fast enough by itself to drive prices significantly. The more likely driver is the Lehigh Valley’s broader appeal as a lower-cost alternative to the New York and Philadelphia metro areas.
Similar Markets in PA
If you’re considering Allentown, these Pennsylvania cities are worth comparing:
- Bethlehem — Right next door in the Lehigh Valley, with nearly five times the population growth rate.
- Reading — About 45 minutes west, matching Allentown’s 1.1% population growth at a potentially different price point.
- Easton — The third city in the Allentown-Bethlehem-Easton metro, sharing the same regional market dynamics.
- Lancaster — A slightly smaller city with 0.9% growth, popular with buyers seeking a different pace.
- Philadelphia — The state’s largest market, for buyers who want urban density at a different price point.
Frequently Asked Questions
What is the average home price in Allentown?
The average home price in Allentown is $300,138 as of February 2026. Prices vary widely by ZIP code, from $203,098 in 18101 to $432,976 in 18106. That $229K gap means your neighborhood choice matters more than the city average.
Are home prices going up or down in Allentown?
Prices are going up. Allentown posted a 4.4% year-over-year gain, and the median has increased every month for at least 12 straight months. In March 2025, the average was $287,429 — it has since added $12,709 in value.
Is it cheaper to rent or buy in Allentown?
It depends on the ZIP code. In 18101, the estimated mortgage payment of $1,027 is well below the $1,650 median rent, making buying the cheaper option. In higher-priced ZIPs like 18104, monthly ownership costs (including taxes and insurance) are roughly comparable to the $2,139 rent.
What is the most affordable neighborhood in Allentown?
ZIP code 18101 is the most affordable at $203,098 — 32% below the city median. It’s the only area in Allentown where you can buy for under $210K. The next cheapest is 18102 at $214,327.
Methodology
Home values are based on the Zillow Home Value Index (ZHVI), a smoothed measure of typical home values in the 35th to 65th percentile range. Rent estimates use the Zillow Observed Rent Index (ZORI). Population figures come from the U.S. Census Bureau Population Estimates Program (2020-2024 vintage). All datasets are publicly available. Housing data updated 2026-02-28.