San Bernardino Home Prices: $452K, Down 0.5% — 7 ZIPs Analyzed (2026)
$452,019. That’s what a typical home costs in San Bernardino right now — and it’s barely moved in a year. Prices slipped 0.5% compared to February 2025, making this one of the flattest markets in the Inland Empire. Across 7 ZIP codes, values range from $381K to $536K.
Quick answer: The average home price in San Bernardino, CA is $452,019 as of February 2026, down 0.5% year over year according to Zillow.
Current Home Prices in San Bernardino
| Metric | Value |
|---|---|
| Median Home Value | $452,019 |
| Year-over-Year Change | -0.5% |
| Lowest ZIP Code Value | $380,769 |
| Highest ZIP Code Value | $535,697 |
| Number of ZIPs Tracked | 7 |
| Data as of | February 2026 |
A half-percent decline barely registers. In practical terms, a home worth $454,388 a year ago would sell for about $2,400 less today. That’s noise, not a crash.
The price floor sits at $381K in the downtown core, while the northern parts of the city push past $535K. That $155,000 gap means your neighborhood choice matters more than timing the market.
San Bernardino sits in the Riverside-San Bernardino-Ontario metro, where it remains one of the more affordable entry points. Buyers priced out of Los Angeles or Orange County have been looking east for years, and this city keeps absorbing that demand — just not enough to push prices up meaningfully.
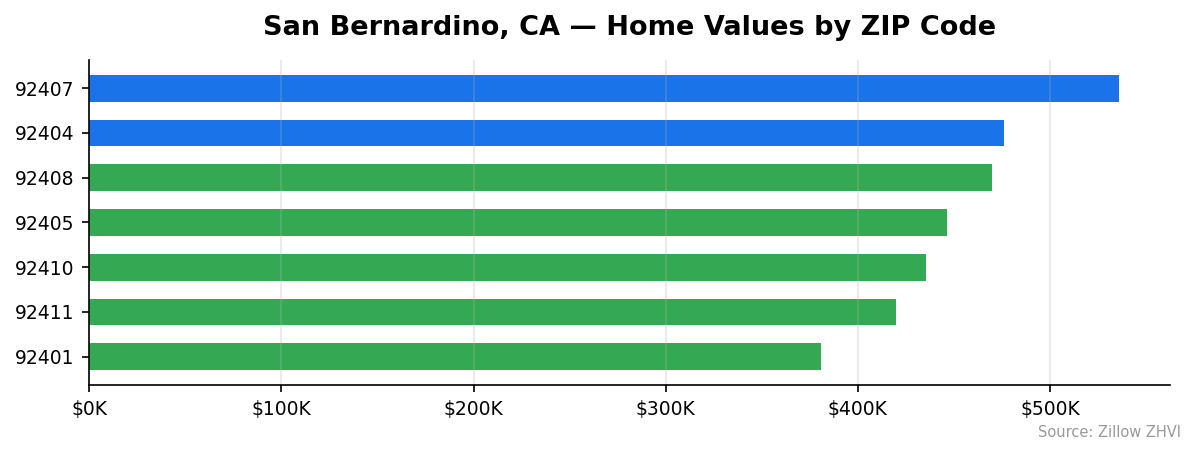
San Bernardino Home Prices by Neighborhood
| ZIP Code | Typical Home Value | Typical Rent |
|---|---|---|
| 92407 | $535,697 | $2,041/mo |
| 92404 | $476,244 | $1,813/mo |
| 92408 | $469,536 | Data not available |
| 92405 | $446,221 | $1,897/mo |
| 92410 | $435,648 | $1,888/mo |
| 92411 | $420,021 | $2,990/mo |
| 92401 | $380,769 | Data not available |
Most Expensive ZIPs
92407 leads at $535,697, sitting 18.5% above the city median — this northern area commands a premium while offering rents of just $2,041, making it a relatively better value for owners. 92404 comes in at $476,244 with the lowest tracked rent at $1,813, which is notable for buyers considering rental income. 92408 rounds out the top three at $469,536, though rent data isn’t yet available for this ZIP.
Most Affordable ZIPs
92401 is the cheapest entry point at $380,769 — nearly $71,000 below the city average and the only ZIP under $400K. 92411 at $420,021 is the second most affordable to buy, but carries the highest rent at $2,990, an unusual gap that may reflect rental housing stock differences. 92410 at $435,648 offers a middle-ground option with rents tracking at $1,888.
Rent vs Buy in San Bernardino
Rents in San Bernardino vary wildly by ZIP code, ranging from $1,813 in 92404 to $2,990 in 92411.
Here’s the math. Take the city median of $452,019. Put 20% down ($90,404), and you’re financing $361,615. At a 7% mortgage rate over 30 years, your principal and interest payment lands around $2,406 per month. Add property taxes (roughly 1.1% in San Bernardino County, or $414/month) and insurance (~$150/month), and your total monthly cost is approximately $2,970.
| Monthly Cost | |
|---|---|
| Estimated mortgage payment (P&I) | ~$2,406 |
| Property tax + insurance | ~$564 |
| Total ownership cost | ~$2,970 |
| Typical rent (range) | $1,813 – $2,990 |
In most ZIP codes, renting is cheaper. The median rent across tracked areas falls well below $2,970. The exception is 92411, where rents hit $2,990 — at that point, buying starts to make financial sense if you plan to stay five or more years.
If you’re renting at $1,813 in 92404 and considering buying in the same ZIP at $476K, you’d pay roughly $1,100 more per month to own. That’s a steep premium for equity building.
Population Growth and Migration
San Bernardino’s population reached 224,775 in 2024, up 1.2% from 222,119 in 2020. The city is growing, though not quickly.
| Year | Population |
|---|---|
| 2020 | 222,119 |
| 2021 | 220,644 |
| 2022 | 222,444 |
| 2023 | 223,676 |
| 2024 | 224,775 |
The dip in 2021 — losing nearly 1,500 residents — was a pandemic-era blip. Since then, the city has added people every year, gaining over 4,100 residents from 2021 to 2024.
How does that compare to other California cities?
| City | 2024 Population | 4-Year Growth |
|---|---|---|
| San Diego | 1,404,452 | 1.4% |
| Fresno | 550,105 | 1.4% |
| Sacramento | 535,798 | 1.9% |
| Oakland | 443,554 | 0.6% |
| Bakersfield | 417,468 | 3.0% |
| San Bernardino | 224,775 | 1.2% |
San Bernardino’s growth rate of 1.2% trails Bakersfield (3.0%) and Sacramento (1.9%), but outpaces Oakland (0.6%). Steady population growth, even at this modest pace, puts a floor under housing demand. More people means more households competing for the same housing stock.
San Bernardino Housing Market Trends
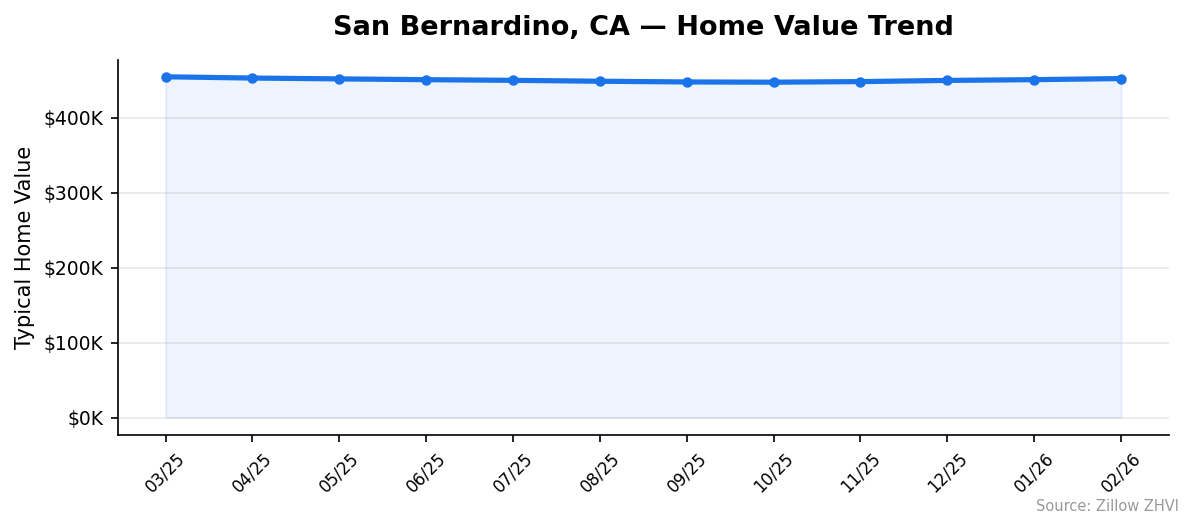
The 12-month trend tells a story of a market that dipped, bottomed out, and started climbing back.
| Month | Average Home Value |
|---|---|
| March 2025 | $454,388 |
| April 2025 | $452,700 |
| May 2025 | $451,598 |
| June 2025 | $450,530 |
| July 2025 | $449,668 |
| August 2025 | $448,463 |
| September 2025 | $447,501 |
| October 2025 | $447,195 |
| November 2025 | $447,976 |
| December 2025 | $449,562 |
| January 2026 | $450,564 |
| February 2026 | $452,019 |
Prices fell for seven straight months from March through October 2025, shedding about $7,200 — a 1.6% decline. Then the reversal started. November through February saw four consecutive months of gains, recovering nearly all of that lost ground.
October 2025 marked the bottom at $447,195. Since then, values have climbed $4,824, or 1.1%. The recovery has been gradual but consistent, with each month posting a slightly larger gain than the one before.
Is San Bernardino a Good Place to Buy in 2026?
The data points to a balanced market. Prices aren’t surging, and they aren’t falling. A 0.5% year-over-year decline is essentially flat.
For buyers, this is good news. You’re not chasing a runaway market, and you’re not catching a falling knife. The four-month rebound from October’s low suggests the floor is in, at least for now.
The $155,000 spread between the cheapest and most expensive ZIPs gives you options. A first-time buyer can get into 92401 at $381K, while someone looking for more space can target 92407 at $536K — still well below comparable areas closer to the coast.
One concern: renting remains cheaper than buying in most areas. If you’re purely optimizing for monthly cash flow, the numbers favor renting. But if you’re planning to stay five-plus years and want to build equity in a market that’s holding steady, San Bernardino offers a reasonable entry point for Southern California.
San Bernardino Housing Market Outlook for 2026-2027
The recent four-month upward trend offers a clue about where prices are heading. From October 2025 to February 2026, values climbed an average of $1,200 per month. If that pace continues through summer — historically the strongest season for home sales — prices could push past $455K by mid-2026.
But there’s a ceiling visible in the data. A year ago, the average sat at $454,388. The market hasn’t been able to sustain prices above that level for long. Each time values approach $454K-$455K, they’ve pulled back.
The 3-month trend suggests moderate upward pressure. Don’t expect a breakout year. Expect sideways movement with a slight upward tilt — probably finishing 2026 within 1-2% of where it started.
Similar Markets in CA
If you’re weighing options across California, these cities offer useful comparisons:
- Fontana — a neighboring Inland Empire city that shares San Bernardino’s commuter appeal.
- Riverside — the other half of the metro area, often slightly pricier but with a larger downtown core.
- Bakersfield — one of California’s most affordable mid-size cities, with 3% population growth outpacing San Bernardino.
- Fresno — another Central Valley option for buyers seeking affordability in a growing California city.
- Long Beach — closer to the coast and LA, but worth comparing if you want to see what a premium buys you.
Frequently Asked Questions
What is the average home price in San Bernardino?
The average home price in San Bernardino is $452,019 as of February 2026. That figure represents the typical home value across 7 tracked ZIP codes, with individual neighborhoods ranging from $380,769 in 92401 to $535,697 in 92407.
Are home prices going up or down in San Bernardino?
Prices are down 0.5% year over year, but the short-term trend is upward. After falling for seven months through October 2025, values have rebounded for four straight months. The market appears to be stabilizing rather than declining.
Is it cheaper to rent or buy in San Bernardino?
Renting is cheaper in most neighborhoods. Typical rents range from $1,813 to $2,990 per month, while total homeownership costs on the median home run about $2,970 monthly. Only in the highest-rent ZIP (92411 at $2,990) does buying become cost-competitive on a monthly basis.
What is the most affordable neighborhood in San Bernardino?
ZIP code 92401 in the downtown area has the lowest home values at $380,769 — about $71,000 below the city average. It’s the only San Bernardino ZIP where typical values fall under $400,000.
Methodology
Home values are based on the Zillow Home Value Index (ZHVI), a smoothed measure of typical home values in the 35th to 65th percentile range. Rent estimates use the Zillow Observed Rent Index (ZORI). Population figures come from the U.S. Census Bureau Population Estimates Program (2020-2024 vintage). All datasets are publicly available. Housing data updated 2026-02-28.