San Jose Home Prices: $1,442K, Down 1.1% — 28 ZIPs Analyzed (2026)
$1,441,970. That’s what a typical home costs in San Jose right now. Prices slipped 1.1% over the past year, but this is still one of the most expensive housing markets in the country. Across 28 ZIP codes, the spread runs from $664K to $2.68 million.
Quick answer: The average home price in San Jose, CA is $1,441,970 as of February 2026, down 1.1% year over year according to Zillow.
Current Home Prices in San Jose
| Metric | Value |
|---|---|
| Median Home Price | $1,441,970 |
| Year-over-Year Change | -1.1% |
| Lowest ZIP Price | $664,064 |
| Highest ZIP Price | $2,679,447 |
| Number of ZIPs Tracked | 28 |
| Data as of | February 2026 |
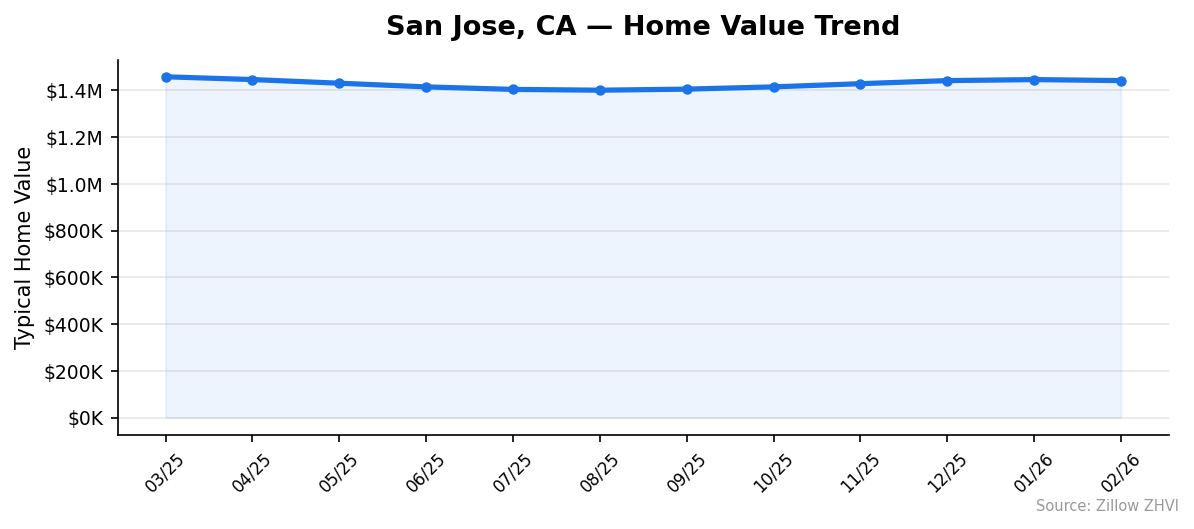
The 1.1% annual decline looks small on paper, and it is. San Jose hasn’t seen a meaningful correction — prices dipped to roughly $1.4 million in mid-2025 before climbing back through the fall and winter. The current median sits just $91 below where it was in December 2025. That’s essentially flat.
What stands out is the range. The gap between the cheapest and most expensive ZIP codes is over $2 million. You’re not buying into one market when you shop in San Jose — you’re choosing between a dozen different price tiers, each with its own math.
For a buyer earning the metro area’s median household income, the entry-level ZIPs around $664K–$940K are the only realistic targets without significant wealth or dual high incomes.
San Jose Home Prices by Neighborhood
| ZIP Code | Median Home Price | Typical Rent |
|---|---|---|
| 95129 | $2,679,447 | $3,414 |
| 95120 | $2,256,137 | $4,914 |
| 95130 | $2,168,311 | $3,025 |
| 95124 | $1,961,135 | $3,760 |
| 95125 | $1,885,893 | $3,358 |
| 95117 | $1,799,371 | $2,703 |
| 95135 | $1,758,213 | $4,479 |
| 95118 | $1,676,126 | $3,918 |
| 95132 | $1,672,154 | $3,615 |
| 95148 | $1,539,922 | $4,049 |
| 95128 | $1,469,372 | $3,132 |
| 95119 | $1,426,268 | Data not available |
| 95136 | $1,389,976 | $3,224 |
| 95123 | $1,381,573 | $3,213 |
| 95131 | $1,368,897 | $3,555 |
| 95139 | $1,361,280 | Data not available |
| 95002 | $1,255,268 | Data not available |
| 95121 | $1,256,963 | $2,871 |
| 95126 | $1,193,850 | $2,933 |
| 95133 | $1,166,076 | $3,318 |
| 95127 | $1,109,005 | $3,345 |
| 95134 | $1,093,887 | $3,405 |
| 95111 | $1,069,307 | $3,194 |
| 95112 | $1,006,941 | $2,941 |
| 95122 | $990,519 | $2,953 |
| 95116 | $936,838 | $3,184 |
| 95110 | $838,359 | $3,017 |
| 95113 | $664,064 | $3,478 |
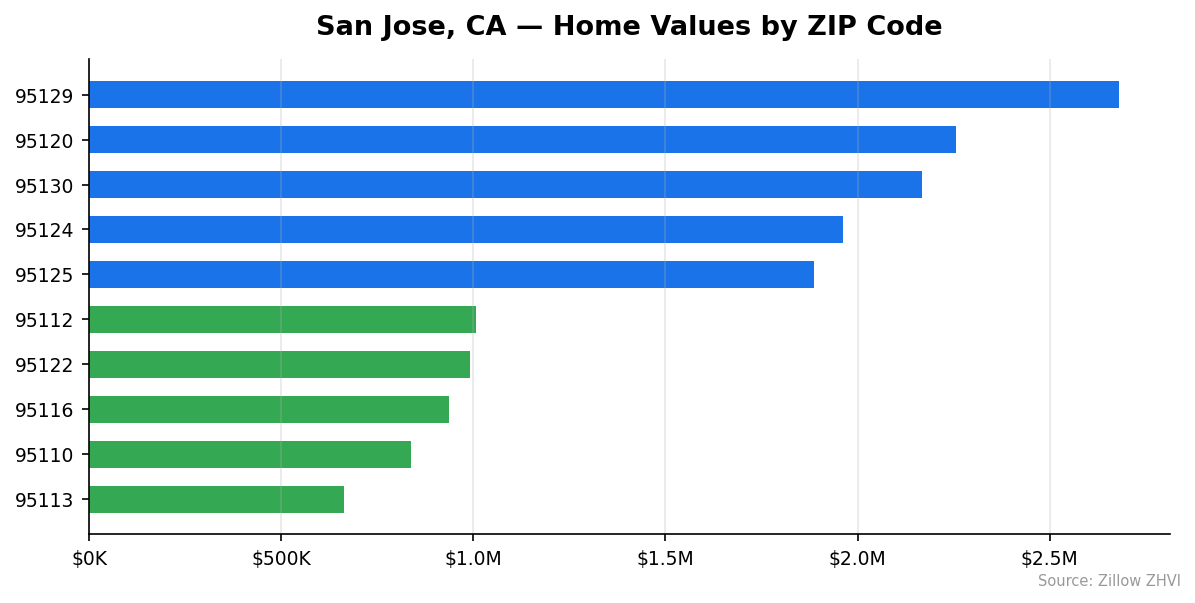
Most Expensive ZIPs
95129 tops the list at $2,679,447 — nearly double the city median. Despite the price tag, rents here are a moderate $3,414, giving it one of the lowest price-to-rent ratios in the city.
95120 comes in at $2,256,137 with the highest rents in San Jose at $4,914/month, reflecting strong demand from families in this southern stretch of the city.
95130 rounds out the top three at $2,168,311, though rents are just $3,025 — among the lowest for any high-value ZIP, suggesting an ownership-heavy market.
Most Affordable ZIPs
95113 in downtown San Jose is the clear outlier at $664,064 — 54% below the city median. Interestingly, rents here are $3,478, well above average, pointing to a renter-heavy area where buying could make more financial sense.
95110 sits at $838,359, one of only two ZIPs below $1 million. Rents of $3,017 are mid-range for the city.
95116 at $936,838 is the last ZIP under the $1 million mark, with rents of $3,184. All three affordable ZIPs are concentrated in central and east San Jose.
Rent vs Buy in San Jose
The rent-vs-buy math in San Jose is brutal for buyers.
| Scenario | Monthly Cost |
|---|---|
| Median Rent (typical ZIP) | ~$3,300 |
| Mortgage on Median Home (20% down, 6.8%) | ~$7,530 |
| Mortgage on Cheapest ZIP (20% down, 6.8%) | ~$3,460 |
| Highest Rent (95120) | $4,914 |
With 20% down on the median home ($288,394 out of pocket), your monthly payment would land around $7,530 — more than double typical rents. Even with the tax deduction on mortgage interest, the gap is enormous.
The only ZIP where buying approaches parity with renting is 95113. A mortgage on the $664K median there would run roughly $3,460/month versus $3,478 in rent. That’s nearly breakeven — rare anywhere in the Bay Area.
For most San Jose ZIPs, you’re paying a $3,000–$4,000 monthly premium to own instead of rent. The bet is on long-term appreciation, which has been strong historically but showed a -1.1% return this past year.
Population Growth and Migration
San Jose is shrinking. The city fell from 1,009,686 residents in 2020 to 997,368 in 2024 — a loss of 12,318 people, or -1.2%.
| Year | Population |
|---|---|
| 2020 | 1,009,686 |
| 2021 | 981,446 |
| 2022 | 978,451 |
| 2023 | 983,734 |
| 2024 | 997,368 |
The sharp drop came in 2021 and 2022, when the city lost over 31,000 residents. Remote work opened the door for tech workers to leave, and many walked through it. Since 2022, the trend has reversed — San Jose added roughly 19,000 residents over the next two years. The bleeding stopped, but the city hasn’t recovered to pre-pandemic levels.
Compare that to other California cities:
| City | 2024 Population | 4-Year Growth |
|---|---|---|
| San Diego | 1,404,452 | +1.4% |
| Fresno | 550,105 | +1.4% |
| Sacramento | 535,798 | +1.9% |
| Bakersfield | 417,468 | +3.0% |
| Stockton | 324,975 | +1.2% |
| San Jose | 997,368 | -1.2% |
Every comparable California city grew. San Jose is the outlier. The cost of housing is the likely driver — when cheaper metros offer similar amenities, people move. That said, the 2023-2024 rebound suggests the outflow may have peaked.
San Jose Housing Market Trends
| Month | Avg Home Price | Lowest ZIP | Highest ZIP |
|---|---|---|---|
| Feb 2026 | $1,441,970 | $664,064 | $2,679,447 |
| Jan 2026 | $1,446,155 | $666,616 | $2,685,223 |
| Dec 2025 | $1,441,879 | $668,436 | $2,671,493 |
| Nov 2025 | $1,428,709 | $669,706 | $2,632,588 |
| Oct 2025 | $1,415,032 | $670,884 | $2,593,198 |
| Sep 2025 | $1,405,366 | $673,587 | $2,560,994 |
| Aug 2025 | $1,400,847 | $680,264 | $2,542,844 |
| Jul 2025 | $1,404,229 | $690,754 | $2,539,641 |
| Jun 2025 | $1,414,949 | $703,511 | $2,551,761 |
| May 2025 | $1,430,760 | $714,016 | $2,573,777 |
| Apr 2025 | $1,446,350 | $723,772 | $2,594,275 |
| Mar 2025 | $1,458,198 | $730,513 | $2,606,077 |
The story here isn’t a single trend — it’s two. From March to August 2025, prices dropped $57,000, falling from $1,458,198 to $1,400,847. Then from August onward, they climbed $41,000 back to $1,441,970.
The V-shape is clearest in the high end. The most expensive ZIP swung from $2.61M down to $2.54M and back to $2.68M. Meanwhile, the cheapest ZIP moved in the opposite direction — falling from $731K in March to $664K in February. Affordable areas got cheaper while expensive ones recovered.
Is San Jose a Good Place to Buy in 2026?
The data paints a mixed picture.
On the buy side: prices are 1.1% lower than a year ago, the market has stabilized after the mid-2025 dip, and population is slowly recovering. If you’re already in the San Jose job market — particularly tech — you’re buying into an area with strong long-term demand.
On the wait side: mortgage payments on the median home run over $7,500/month. Renting saves you $3,000–$4,000 per month that could go into investments. The year-over-year return is negative.
If you’re buying below $1 million — in ZIPs like 95113, 95110, or 95116 — the math gets closer to workable. Above $1.5 million, you need substantial income or equity from a prior sale. This isn’t a market where first-time buyers jump in casually.
San Jose Housing Market Outlook for 2026-2027
The 6-month trend from August 2025 to February 2026 shows steady upward movement — about $6,800 per month on average. If that pace continues through 2026, prices could push past $1.48 million by late summer.
But the year-over-year number tells a different story. Prices in March 2025 were $1,458,198 — higher than today’s $1,441,970. The market hasn’t actually grown in 12 months.
The most likely scenario: prices continue a slow grind upward through spring and summer selling season, potentially reaching their March 2025 peak. A break above $1.46 million would signal the start of a new leg up. A stall below $1.44 million would suggest the market is range-bound.
Watch the affordable end. The cheapest ZIPs dropped from $731K to $664K in 12 months — a 9% decline. If that continues, entry-level buyers may find better deals ahead.
Similar Markets in CA
- Los Angeles — A larger market with significantly lower median prices and more inventory variety than San Jose.
- San Diego — Growing population (+1.4%) and more moderate pricing make San Diego a popular alternative for California buyers.
- Long Beach — Coastal living at a fraction of San Jose prices, with an active port economy.
- Anaheim — Orange County location with lower price points and a different employment base than Silicon Valley.
- Fresno — For buyers priced out entirely, Fresno offers California living at a steep discount with 1.4% population growth.
Frequently Asked Questions
What is the average home price in San Jose?
The average home price in San Jose is $1,441,970 as of February 2026. Prices range from $664,064 in ZIP 95113 to $2,679,447 in ZIP 95129 — a spread of over $2 million across the city’s 28 tracked neighborhoods.
Are home prices going up or down in San Jose?
Prices are down 1.1% year over year. However, the recent trend is upward — values rose about $41,000 between August 2025 and February 2026 after hitting a mid-year low. The market appears to be stabilizing rather than declining sharply.
Is it cheaper to rent or buy in San Jose?
Renting is substantially cheaper. Typical monthly rents run $3,200–$3,400, while a mortgage on the median home with 20% down would cost roughly $7,530/month. The only ZIP where buying costs approach renting is 95113 downtown, where the $664K median produces payments close to the $3,478 typical rent.
What is the most affordable neighborhood in San Jose?
ZIP code 95113 in downtown San Jose is the most affordable at $664,064 — 54% below the city median. The next cheapest options are 95110 at $838,359 and 95116 at $936,838. All three are in central and east San Jose.
Methodology
Home values are based on the Zillow Home Value Index (ZHVI), a smoothed measure of typical home values in the 35th to 65th percentile range. Rent estimates use the Zillow Observed Rent Index (ZORI). Population figures come from the U.S. Census Bureau Population Estimates Program (2020-2024 vintage). All datasets are publicly available. Housing data updated 2026-02-28.