Anaheim Home Prices: $978K, Down 0.1% — 7 ZIPs Analyzed (2026)
Can you still afford a house in Anaheim? The median home is now worth $978,059. That’s essentially unchanged from a year ago, down just 0.1%. For a city in the LA metro, that price plateau is noteworthy.
Quick answer: The average home price in Anaheim, CA is $978,059 as of February 2026, down 0.1% year over year according to Zillow.
Current Home Prices in Anaheim
Here’s where the Anaheim market stands right now:
| Metric | Value |
|---|---|
| Median Home Value | $978,059 |
| Year-over-Year Change | -0.1% |
| Lowest ZIP Median | $842,451 |
| Highest ZIP Median | $1,193,810 |
| Number of ZIP Codes | 7 |
| Data as of | February 2026 |
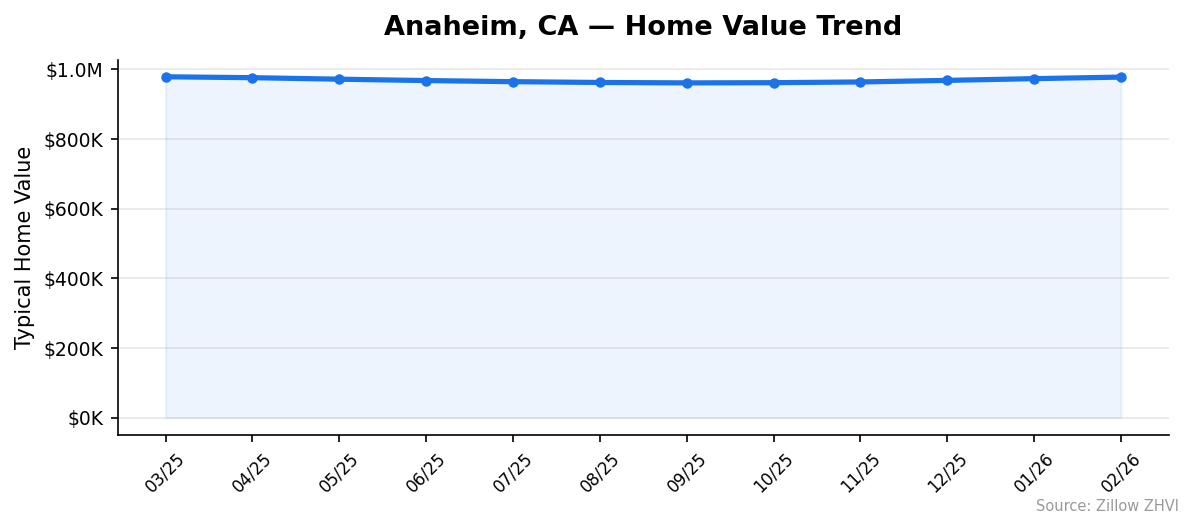
The -0.1% annual change is as close to flat as a market gets. After peaking near $979K in March 2025, values dipped through the summer and fall, bottoming out around $961K in September 2025. Since then, prices have climbed back in five straight months.
That recovery pattern matters. Anaheim didn’t crash. It softened, then bounced. The spread between the cheapest and most expensive neighborhoods is $351,359 — a gap that tells you location within the city still drives massive price differences.
For buyers, the near-zero annual change means you’re not chasing a runaway market. For sellers, it means price cuts aren’t the norm either. The market is in a holding pattern.
Anaheim Home Prices by Neighborhood
All seven Anaheim ZIP codes, ranked by median home value:
| ZIP Code | Median Home Value | Avg Monthly Rent |
|---|---|---|
| 92808 | $1,193,810 | $3,263 |
| 92807 | $1,128,665 | $3,064 |
| 92806 | $979,512 | $2,500 |
| 92802 | $934,207 | $2,635 |
| 92804 | $920,953 | $2,425 |
| 92801 | $846,817 | $2,517 |
| 92805 | $842,451 | $2,795 |
Most Expensive
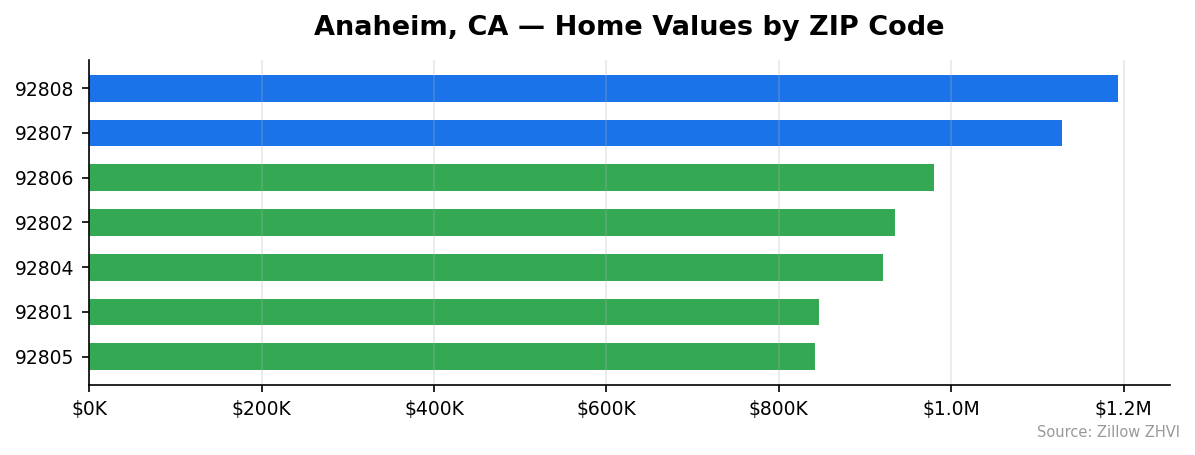
92808 leads at $1,193,810 — 22% above the city median — with rents to match at $3,263 per month. 92807 comes in at $1,128,665, the Anaheim Hills area commanding a 15% premium. 92806 sits right at the city average, $979,512, acting as the middle ground between the hills and the flatlands.
Most Affordable
92805 is the cheapest at $842,451, roughly $136K below the city median, though its rents are actually among the highest at $2,795. 92801 is close behind at $846,817 with moderate rents of $2,517. 92804 rounds out the affordable tier at $920,953 and offers the lowest rents in the city at $2,425.
One oddity: 92805 has the lowest home values but the second-highest rents. That gap between purchase price and rental income could signal investor interest.
Rent vs Buy in Anaheim
The math here is stark.
| Scenario | Monthly Cost |
|---|---|
| Average Rent (city-wide) | ~$2,743 |
| Mortgage (median home, 20% down, 7%) | ~$5,205 |
| Monthly Difference | ~$2,462 |
A 20% down payment on the median Anaheim home requires about $195,612 in cash. The remaining $782,447 at a 7% rate produces a principal-and-interest payment around $5,205 per month. Add property taxes and insurance and you’re well above $6,000.
Renting saves you roughly $2,400 to $3,500 per month depending on the neighborhood. The cheapest rent is in 92804 at $2,425. The priciest is 92808 at $3,263.
For now, the numbers favor renting on a pure cash-flow basis. Buying makes more sense if you plan to stay long-term and want to build equity, but the monthly gap is wide.
Population Growth and Migration
Anaheim is slowly losing residents.
| Year | Population |
|---|---|
| 2020 | 346,665 |
| 2021 | 344,803 |
| 2022 | 343,626 |
| 2023 | 342,883 |
| 2024 | 344,561 |
The city lost 0.6% of its population between 2020 and 2024, dropping by about 2,100 people. There was a small rebound in 2024 after three years of decline, but the overall trend is negative.
Compare that to other California cities:
| City | 2024 Population | 4-Year Growth |
|---|---|---|
| San Diego | 1,404,452 | +1.4% |
| Fresno | 550,105 | +1.4% |
| Sacramento | 535,798 | +1.9% |
| Bakersfield | 417,468 | +3.0% |
| Stockton | 324,975 | +1.2% |
| Anaheim | 344,561 | -0.6% |
Every comparable city is growing. Anaheim is the outlier. High housing costs likely play a role — when the median home approaches $1 million, some residents move to more affordable markets. That population pressure, or lack of it, may explain why prices have flattened rather than climbed.
Anaheim Housing Market Trends
Monthly median home values over the past 12 months:
| Month | Median Value | Change from Prior Month |
|---|---|---|
| Feb 2026 | $978,059 | +$4,427 |
| Jan 2026 | $973,632 | +$4,985 |
| Dec 2025 | $968,647 | +$4,549 |
| Nov 2025 | $964,098 | +$2,092 |
| Oct 2025 | $962,006 | +$601 |
| Sep 2025 | $961,405 | -$1,242 |
| Aug 2025 | $962,647 | -$2,269 |
| Jul 2025 | $964,916 | -$3,205 |
| Jun 2025 | $968,121 | -$3,936 |
| May 2025 | $972,057 | -$4,310 |
| Apr 2025 | $976,367 | -$2,587 |
| Mar 2025 | $978,954 | — |
The pattern is clear: prices slid from March through September 2025, then reversed. The six-month decline shaved about $17,500 off the median. The five-month recovery has added back roughly $16,700. February 2026 sits just $895 below the March 2025 peak.
Monthly gains have been accelerating. October added $601. November added $2,092. February added $4,427. That acceleration suggests the recovery still has momentum.
Is Anaheim a Good Place to Buy in 2026?
The data points to a balanced market. Prices are flat year-over-year, which means neither buyers nor sellers hold a strong advantage.
In favor of buying: prices have been rising for five consecutive months, the decline was shallow (under 2% peak-to-trough), and Anaheim sits in the Los Angeles metro — one of the most supply-constrained markets in the country.
Working against buyers: the $978K median is steep, monthly mortgage costs are nearly double rental costs, and the population is declining. A shrinking population doesn’t typically drive prices higher.
If you can handle the monthly payment and plan to stay at least five years, the flat pricing means you’re not overpaying for a peak. If you’re stretching your budget, the rent-vs-buy gap suggests waiting or looking at neighborhoods like 92805 or 92801 where entry prices are $130K to $135K lower than the city median.
Anaheim Housing Market Outlook for 2026-2027
The five-month upward trend shows increasing momentum. Monthly gains have grown from $601 in October to $4,427 in February. If the current pace continues through spring — historically the strongest season for home sales — the median could push past the March 2025 peak of $978,954 within a month or two.
The 12-month data suggests a ceiling around $979K. Prices approached that level in spring 2025, then pulled back. Whether the market breaks through or stalls again will depend on mortgage rates and local inventory.
The three-month trend line adds about $4,600 per month. If that holds, you could see the median testing the $990K to $1M range by mid-2026. But flat year-over-year growth and population decline argue against a sharp breakout.
Similar Markets in CA
If you’re researching Anaheim, these nearby California markets are worth comparing:
- Los Angeles — the broader metro anchor, with a much larger and more diverse housing stock
- Long Beach — a coastal alternative within the same metro area
- San Diego — another high-cost Southern California market with stronger population growth
- Riverside — the Inland Empire offers lower entry prices for commuters willing to drive
- Bakersfield — the fastest-growing comparable city in the state, with significantly lower prices
Frequently Asked Questions
What is the average home price in Anaheim?
The average home price in Anaheim is $978,059 as of February 2026. That figure represents the city-wide median across all seven tracked ZIP codes. Individual neighborhoods range from $842,451 in 92805 to $1,193,810 in 92808.
Are home prices going up or down in Anaheim?
Prices are essentially flat, down 0.1% year over year. They dipped from March through September 2025, then recovered over five straight months. The market has nearly erased all of last year’s decline.
Is it cheaper to rent or buy in Anaheim?
Renting is considerably cheaper on a monthly basis. The average rent across Anaheim is about $2,743, while a mortgage payment on the median home runs roughly $5,200 per month before taxes and insurance. That’s a gap of nearly $2,500 per month.
What is the most affordable neighborhood in Anaheim?
ZIP code 92805 has the lowest median home value at $842,451. That’s about $136,000 below the city-wide median. The next most affordable is 92801 at $846,817.
Methodology
Home values are based on the Zillow Home Value Index (ZHVI), a smoothed measure of typical home values in the 35th to 65th percentile range. Rent estimates use the Zillow Observed Rent Index (ZORI). Population figures come from the U.S. Census Bureau Population Estimates Program (2020-2024 vintage). All datasets are publicly available. Housing data updated 2026-02-28.