Bloomington Home Prices: $302K, Up 2.4% — 5 ZIPs Analyzed (2026)
$302,255. That’s the median home value in Bloomington, IN as of February 2026. Prices are up 2.4% from a year ago — modest growth in a city whose population is moving the other direction.
Quick answer: The average home price in Bloomington, IN is $302,255 as of February 2026, up 2.4% year over year according to Zillow.
Current Home Prices in Bloomington
The typical Bloomington home costs about $302K. That figure comes from blending values across the city’s 5 ZIP codes, with individual neighborhoods running anywhere from the high $260Ks to the low $340Ks.
| Metric | Value |
|---|---|
| Median home value | $302,255 |
| Year-over-year change | +2.4% |
| Lowest ZIP median | $260,987 (47462) |
| Highest ZIP median | $340,700 (47401) |
| ZIP codes analyzed | 5 |
| Data through | February 2026 |
The 2.4% annual gain puts Bloomington behind hotter Indiana suburbs like Noblesville and Greenwood, but ahead of flat or declining markets in the state. The spread between the cheapest and priciest ZIPs is about $80K — wide for a city this size, and it tells you location matters here more than the headline number suggests.
College towns tend to behave differently from typical metros. Indiana University anchors local demand, which keeps prices steadier than employment-driven markets. The slight upward drift over the past year reflects that — no big moves, just gradual appreciation.
If you bought at the trough in mid-2025, you’ve already gained roughly $7,000 in value. If you’re shopping now, expect to pay close to list in the better ZIPs and find more room to negotiate in the outer ones.
Bloomington Home Prices by Neighborhood
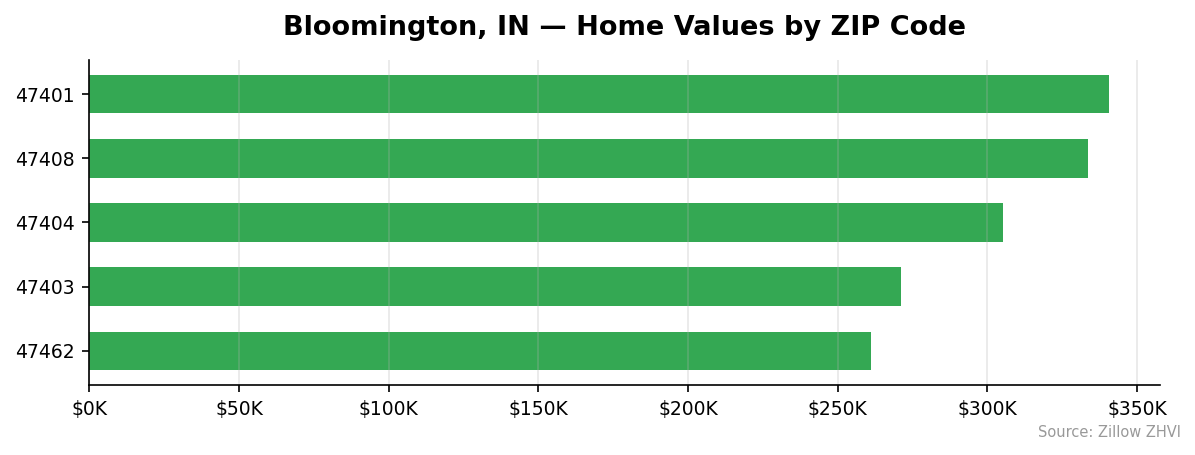
Five ZIPs make up the Bloomington market. Here’s how they compare.
| ZIP Code | Median Home Value | vs. City Avg |
|---|---|---|
| 47401 | $340,700 | +12.7% |
| 47408 | $333,446 | +10.3% |
| 47404 | $305,088 | +0.9% |
| 47403 | $271,056 | -10.3% |
| 47462 | $260,987 | -13.7% |
Most Expensive
47401 — $340,700. The east-side ZIP covers areas closest to IU’s main campus and the established neighborhoods south of 3rd Street. It also commands the highest rent in the city at $1,610.
47408 — $333,446. North of campus, this ZIP runs about $7K below 47401. Rents here average $1,430, lower than you might expect given the home values.
47404 — $305,088. West-side ZIP that lands almost exactly at the city median. Rent of $1,568 is the second-highest in the city, suggesting strong tenant demand even at mid-tier prices.
Most Affordable
47462 — $260,987. The cheapest ZIP, sitting nearly $80K below 47401. No rent data is available, which usually points to a smaller rental market.
47403 — $271,056. Southwest Bloomington. Home values run 10% under the city average and rent is the lowest at $1,370.
47404 — $305,088. Not technically a bottom-three ZIP, but the only mid-priced option. Buyers wanting decent rent yield should look here first.
Rent vs Buy in Bloomington
Renting wins on monthly cost. Here’s the math.
Average rent across the four ZIPs with data: $1,495 a month. The median home at $302,255, financed with 20% down at a 7% rate over 30 years, comes to about $1,609 in principal and interest. Add property tax (roughly $250/month at Indiana rates) and insurance ($100), and you’re looking at $1,960 a month — before any maintenance or HOA fees.
| Cost type | Monthly |
|---|---|
| Average rent (4 ZIPs) | $1,495 |
| Mortgage P&I (20% down, 7%) | $1,609 |
| Property tax (est.) | $250 |
| Insurance (est.) | $100 |
| Total monthly buy cost | ~$1,960 |
Buying costs about $465 more per month. Over a year, that’s $5,580 — money that builds equity if you stay put long enough.
The breakeven horizon in Bloomington is probably 5-7 years, given the modest 2.4% annual appreciation. Students and short-term residents almost always come out ahead renting. Long-term professionals tied to IU or local employers do better buying, especially in the cheaper ZIPs where the gap narrows.
ZIP 47403 is the best rent-to-price ratio in town: $1,370 rent against a $271,056 median price gives landlords a gross yield around 6.1%. ZIP 47401 yields just 5.7% despite the highest rents, because home prices outpaced rent growth.
Population Growth and Migration
Bloomington isn’t growing. The Census puts the 2024 population at 79,986, down from 80,140 in 2020 — a 0.2% decline over four years.
| Year | Population |
|---|---|
| 2020 | 80,140 |
| 2021 | 80,437 |
| 2022 | 80,379 |
| 2023 | 80,262 |
| 2024 | 79,986 |
The peak was 2021. Every year since has shed residents, with 2024 showing the steepest drop at -276 people.
Compare that to other Indiana cities:
| City | 2024 Pop | 4-Year Growth |
|---|---|---|
| Noblesville | 75,239 | +7.2% |
| Greenwood | 68,175 | +6.6% |
| Fishers | 103,986 | +4.5% |
| Carmel | 103,606 | +3.7% |
| Fort Wayne | 273,203 | +3.3% |
| Bloomington | 79,986 | -0.2% |
Indianapolis suburbs are pulling residents fast. Bloomington is losing them.
For housing, this matters. Flat or declining population caps long-term price growth. The fact that home values still rose 2.4% suggests demand from IU enrollment, retirees, and out-of-state buyers is offsetting the resident loss — but it’s a thinner cushion than in growing metros. Inventory shocks would hit harder here than in Fishers or Carmel.
Bloomington Housing Market Trends
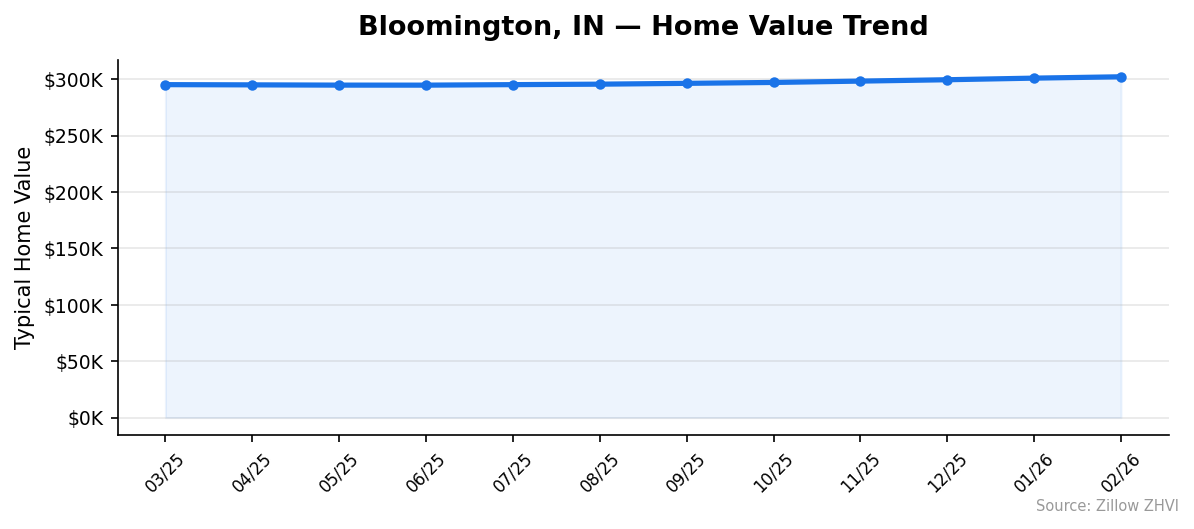
The trajectory has been steady upward for a year, with the steepest gains coming in the most recent months.
| Month | Median Value |
|---|---|
| Feb 2026 | $302,255 |
| Jan 2026 | $301,063 |
| Dec 2025 | $299,638 |
| Nov 2025 | $298,429 |
| Oct 2025 | $297,235 |
| Sep 2025 | $296,445 |
| Aug 2025 | $295,708 |
| Jul 2025 | $295,293 |
| Jun 2025 | $294,845 |
| May 2025 | $294,867 |
| Apr 2025 | $295,094 |
| Mar 2025 | $295,292 |
Read the table from the bottom up. From March to June 2025, prices barely moved — actually dipped slightly in May and June. The market hit its floor at $294,845 in June.
Then prices started climbing every month. The pace accelerated in late fall: November added $1,194, December added $1,209, January added $1,425, and February added $1,192. Five straight months of $1,000+ gains.
Annualized at the 3-month pace, that’s about a 4.7% growth rate — nearly double the 12-month figure. The market got faster, not slower, heading into 2026.
Is Bloomington a Good Place to Buy in 2026?
It depends on your time horizon.
The data points to a slight seller’s market right now. Five months of accelerating price gains, modest annual appreciation, and a wide ZIP-level price spread give buyers room to find value if they’re patient. The cheaper ZIPs (47462, 47403) offer real entry points under $275K — rare in college towns.
The flip side: population is shrinking. That’s a long-term headwind that no amount of student demand can fix forever. If you’re buying to flip in two years, the math may not work. If you’re buying a primary home for 7+ years, the rent-vs-buy gap and slow appreciation should still leave you ahead, especially in the lower-priced ZIPs where carrying costs are manageable.
Investors should focus on 47403. Best rent-yield in the city and the lowest entry price after 47462. Owner-occupants who can stretch should aim for 47404 — middle of the market on price, top-tier on rent demand.
Bloomington Housing Market Outlook for 2026-2027
The 3-month trend suggests prices will keep rising into spring 2026. From November through February, the market added roughly $3,800 in median value — about 1.3% in three months.
If the current pace continues, the median should test $310,000 by mid-2026 and could reach $315,000 by year-end. That assumes no major rate moves and steady IU enrollment.
The flat-to-declining population is the watch item. Most metros need population growth to sustain home price gains beyond inflation. Bloomington has done it on demand from non-residents — students, retirees, second-home buyers. If that pipeline thins, the recent acceleration could stall fast.
For now, the momentum points up. The deceleration risk is real but not visible in the February 2026 numbers.
Similar Markets in IN
- Indianapolis — the state’s largest housing market and a useful benchmark for what a growing Indiana metro looks like.
- Carmel — a top Indianapolis suburb with strong population growth, the opposite demographic story from Bloomington.
- Lafayette — another Indiana college town (Purdue), the closest peer to Bloomington’s market profile.
- Fort Wayne — a larger non-metro option with mid-tier prices and growing population.
- Terre Haute — cheaper alternative for buyers priced out of Bloomington’s $300K+ market.
Frequently Asked Questions
What is the average home price in Bloomington?
The average home price in Bloomington, IN is $302,255 as of February 2026. That figure is the Zillow Home Value Index median across the city’s five ZIP codes, which range from $260,987 in 47462 to $340,700 in 47401.
Are home prices going up or down in Bloomington?
Prices are up 2.4% year over year. The median rose from roughly $295,292 in March 2025 to $302,255 in February 2026, with the fastest gains coming in the most recent five months.
Is it cheaper to rent or buy in Bloomington?
Renting is cheaper monthly. Average rent runs about $1,495 across the four ZIPs with data, while a typical mortgage with 20% down at 7% — including taxes and insurance — costs around $1,960 a month, a $465 monthly gap.
What is the most affordable neighborhood in Bloomington?
ZIP 47462 is the cheapest at $260,987, about 14% below the city median. ZIP 47403 is the next most affordable at $271,056 and offers the best rent-to-price ratio in the city, with rents averaging $1,370.
Methodology
Home values are based on the Zillow Home Value Index (ZHVI), a smoothed measure of typical home values in the 35th to 65th percentile range. Rent estimates use the Zillow Observed Rent Index (ZORI). Population figures come from the U.S. Census Bureau Population Estimates Program (2020-2024 vintage). All datasets are publicly available. Housing data updated 2026-02-28.