Muncie Home Prices: $132K, Up 0.2% — 4 ZIPs Analyzed (2026)
$132,048. That’s the typical home value in Muncie as of February 2026, and it has barely moved in a year. Prices are up just 0.2% — a $260 change that flatlines on any chart.
Quick answer: The average home price in Muncie, IN is $132,048 as of February 2026, up 0.2% year over year according to Zillow.
Current Home Prices in Muncie
The Muncie housing market is one of the cheapest in Indiana for a city its size. The median sits at $132,048. The cheapest tracked ZIP comes in at $82,561, while the priciest pushes past $206,000.
| Metric | Value |
|---|---|
| Median home value | $132,048 |
| Year-over-year change | +0.2% |
| Lowest ZIP value | $82,561 |
| Highest ZIP value | $206,485 |
| ZIPs tracked | 4 |
| Data through | February 2026 |
The spread between the cheapest and priciest ZIP is roughly $124,000 — a 2.5x gap inside the same small city. That’s a wide range for a market with only four tracked ZIPs.
For context, the national median sits well above $300,000. A buyer in Muncie pays less than half what they would in most major metros. You can still find sub-$100,000 homes here, which is rare in 2026.
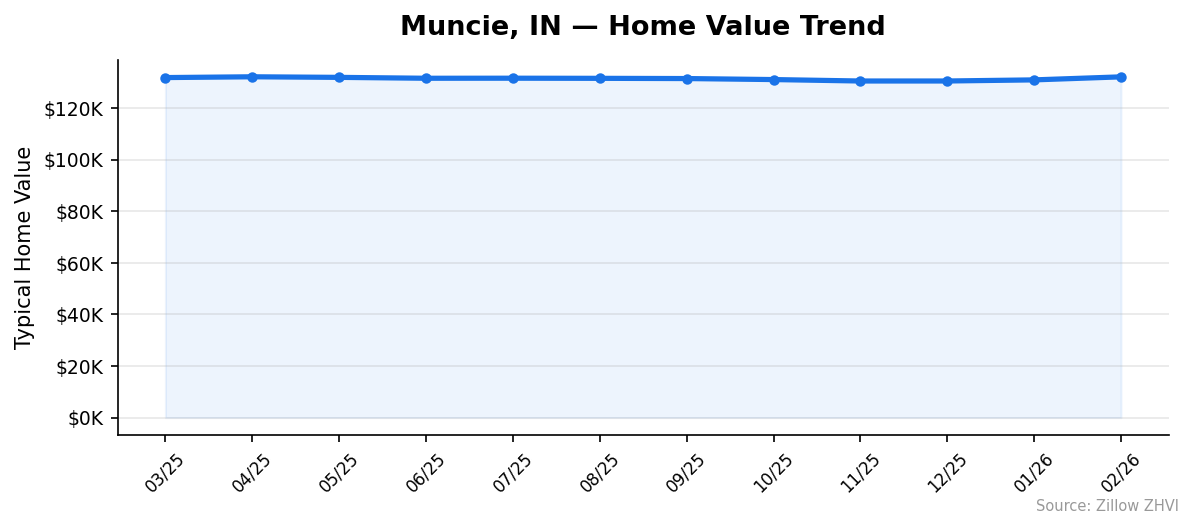
The 0.2% YoY change is essentially noise. Prices climbed in spring 2025, slipped through summer and fall, and recovered in early 2026. The net result: nearly identical to a year ago.
Muncie Home Prices by Neighborhood
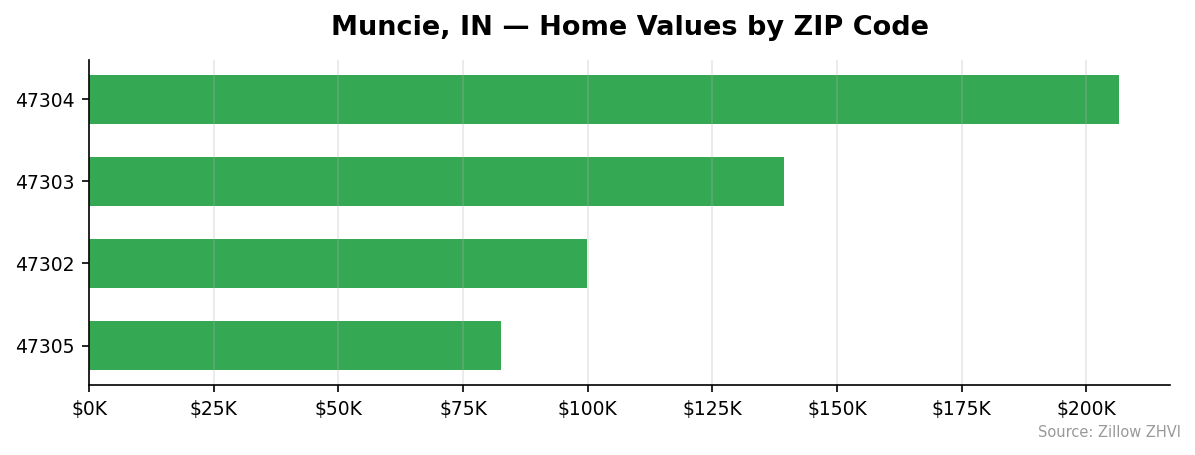
Four ZIPs cover the Muncie market. The price gap between them is the story.
| ZIP | Typical Home Value | Avg Rent |
|---|---|---|
| 47304 | $206,485 | $1,227 |
| 47303 | $139,287 | $984 |
| 47302 | $99,860 | $962 |
| 47305 | $82,561 | — |
Most Expensive
- 47304 — $206,485. The priciest ZIP in Muncie, sitting 56% above the city median. Rents here average $1,227, the highest tracked.
- 47303 — $139,287. Slightly above the city median, with rents at $984 monthly. The middle-tier option.
- 47302 — $99,860. Below the city median by 24%, but above the floor. Rent runs $962, nearly identical to 47303 despite cheaper homes.
Most Affordable
- 47305 — $82,561. The cheapest ZIP, 37% below the Muncie median. No rent data is tracked here.
- 47302 — $99,860. The second-cheapest, and the only sub-$100K ZIP with rent data attached.
- 47303 — $139,287. The cheapest of the higher-tier ZIPs, but still nearly $67,000 below 47304.
If you’re hunting for the lowest price tag, 47305 is the floor. If you want rent data to weigh against a mortgage, 47302 is your best bet under $100K.
Rent vs Buy in Muncie
Rents range from $962 in 47302 to $1,227 in 47304. The citywide picture: roughly $1,000 a month gets you into a typical Muncie rental.
Buying math at the $132,048 median:
| Cost component | Estimate |
|---|---|
| Median home price | $132,048 |
| 20% down payment | $26,410 |
| Loan amount | $105,638 |
| Estimated monthly P&I (7% rate, 30-year) | ~$703 |
| Property tax + insurance (rough estimate) | ~$200 |
| Total monthly housing cost | ~$903 |
A mortgage on the median home runs about $903 monthly with 20% down. The average tracked rent is $1,058. Owning beats renting by roughly $155 a month before maintenance.
Drop the down payment to 10% and the gap narrows. Push it to 5% and renting may pencil out cheaper short-term. But over five years, the equity build typically swings the math back to buying — especially at these price points.
The takeaway: Muncie is one of the few markets in 2026 where buying is still clearly cheaper than renting at the median. Low entry prices do most of the work.
Population Growth and Migration
Muncie is growing — barely. The 2024 population stands at 65,320, up from 65,100 in 2020. That’s 0.3% growth over four years.
| Year | Population |
|---|---|
| 2020 | 65,100 |
| 2021 | 65,195 |
| 2022 | 65,163 |
| 2023 | 65,145 |
| 2024 | 65,320 |
The trend dipped slightly mid-decade before recovering in 2024. Net migration is essentially flat, which fits a college town anchored by Ball State University.
How does that compare to other Indiana cities?
| City | 2024 Population | 4-Yr Growth |
|---|---|---|
| Fort Wayne | 273,203 | +3.3% |
| Fishers | 103,986 | +4.5% |
| Carmel | 103,606 | +3.7% |
| Noblesville | 75,239 | +7.2% |
| Lafayette | 71,757 | +1.4% |
| Muncie | 65,320 | +0.3% |
Muncie trails every comparison city on growth. Noblesville added population 24x faster. That matters for housing: weak population growth caps demand, which explains why prices have moved sideways for a year.
For buyers, flat demand keeps prices in check. For sellers, it means longer days on market and fewer bidding wars.
Muncie Housing Market Trends
Twelve months of data show a market that grinds in place.
| Month | Median |
|---|---|
| 2026-02 | $132,048 |
| 2026-01 | $130,873 |
| 2025-12 | $130,442 |
| 2025-11 | $130,438 |
| 2025-10 | $130,996 |
| 2025-09 | $131,389 |
| 2025-08 | $131,474 |
| 2025-07 | $131,525 |
| 2025-06 | $131,502 |
| 2025-05 | $131,849 |
| 2025-04 | $132,073 |
| 2025-03 | $131,771 |
The 12-month range: $130,438 to $132,073. That’s a swing of $1,635 — about 1.2% from peak to trough. By housing market standards, this is a flat line.
Prices peaked in April 2025 at $132,073, slid for seven straight months, bottomed in November, then climbed back to $132,048 by February 2026. The recent three-month trend is up: November $130,438 → February $132,048, a $1,610 gain.
That recent uptick is the only directional signal in the data. Whether it holds through spring is the question.
Is Muncie a Good Place to Buy in 2026?
For affordability-focused buyers, yes. The data points to a buyer-friendly market with caveats.
Reasons it works:
- The $132,048 median is well below national figures
- 47305 lets you buy under $85,000 — a number that barely exists elsewhere
- Owning is cheaper than renting at the median
- Prices are flat, so you’re not chasing a moving target
Reasons to pause:
- Population growth of 0.3% over four years is weak
- Flat prices mean weak appreciation as a wealth-building tool
- The 47304-to-47305 gap means neighborhood selection matters more than usual
- Rent yields are modest if you’re buying as an investor
Owner-occupants get the better deal here. Investors looking for appreciation will find faster-growing Indiana markets like Noblesville or Fishers.
Muncie Housing Market Outlook for 2026-2027
The 3-month trend points modestly higher. Prices have climbed $1,610 from November to February, after a seven-month slide.
If the current pace continues, the median could test the April 2025 peak of $132,073 sometime this spring. That’s a small move in absolute terms, but it would mark a clear shift from the down trend that dominated mid-to-late 2025.
The flat 12-month YoY of 0.2% suggests this market lacks the demand pressure to break out sharply. Population growth of 0.3% over four years won’t suddenly accelerate. Expect more of the same: small monthly moves, no dramatic swings, and a market that rewards patient buyers willing to hunt for the right ZIP.
Watch the spring numbers. If March and April push above $132,500, the trend has legs. If they stall, expect another sideways year.
Similar Markets in IN
- Indianapolis — Indiana’s largest market, with prices well above Muncie’s median.
- Fort Wayne — A bigger northeastern Indiana city with stronger population growth.
- Lafayette — Another mid-size Indiana college town with comparable demographics.
- Bloomington — Home of IU, a useful comparison for Muncie’s Ball State economy.
- Terre Haute — A western Indiana city with similar population scale and pricing.
Frequently Asked Questions
What is the average home price in Muncie?
The average home price in Muncie, IN is $132,048 as of February 2026. That figure reflects the typical mid-tier home across the four ZIPs tracked in the city. Prices range from $82,561 in 47305 to $206,485 in 47304.
Are home prices going up or down in Muncie?
Prices are up 0.2% year over year — essentially flat. Values dipped through summer and fall 2025 before recovering $1,610 over the past three months. The 12-month price range was just $1,635 from peak to trough.
Is it cheaper to rent or buy in Muncie?
Buying is cheaper at the median. A mortgage on the $132,048 median home runs roughly $903 a month with 20% down, including taxes and insurance. Average rent across tracked ZIPs is $1,058 — about $155 more per month than owning.
What is the most affordable neighborhood in Muncie?
ZIP 47305 is the cheapest, with a typical home value of $82,561. That’s 37% below the city median and the lowest price point of any tracked Muncie ZIP. ZIP 47302 is the next cheapest at $99,860.
Methodology
Home values are based on the Zillow Home Value Index (ZHVI), a smoothed measure of typical home values in the 35th to 65th percentile range. Rent estimates use the Zillow Observed Rent Index (ZORI). Population figures come from the U.S. Census Bureau Population Estimates Program (2020-2024 vintage). All datasets are publicly available. Housing data updated 2026-02-28.