Average Home Price in Chandler AZ (2026): Trends, Data & Analysis
$541,613. That’s what a typical home costs in Chandler right now — and it’s less than it was a year ago. Prices have slipped 1.7% year over year, a modest pullback after years of appreciation in the Phoenix metro. For buyers who’ve been waiting on the sidelines, the question is whether this dip has further to go.
Quick answer: The average home price in Chandler, AZ is $541,613 as of February 2026, down 1.7% year over year according to Zillow.
Current Home Prices in Chandler
Here’s where the Chandler housing market stands as of February 2026:
| Metric | Value |
|---|---|
| Median Home Value | $541,613 |
| Year-Over-Year Change | -1.7% |
| Lowest ZIP Code Value | $446,247 |
| Highest ZIP Code Value | $675,784 |
| Number of ZIP Codes Tracked | 6 |
The 1.7% annual decline translates to roughly $9,400 in lost value on a median-priced home. That’s not a crash. It’s a correction — the kind that trims pandemic-era froth without fundamentally reshaping the market.
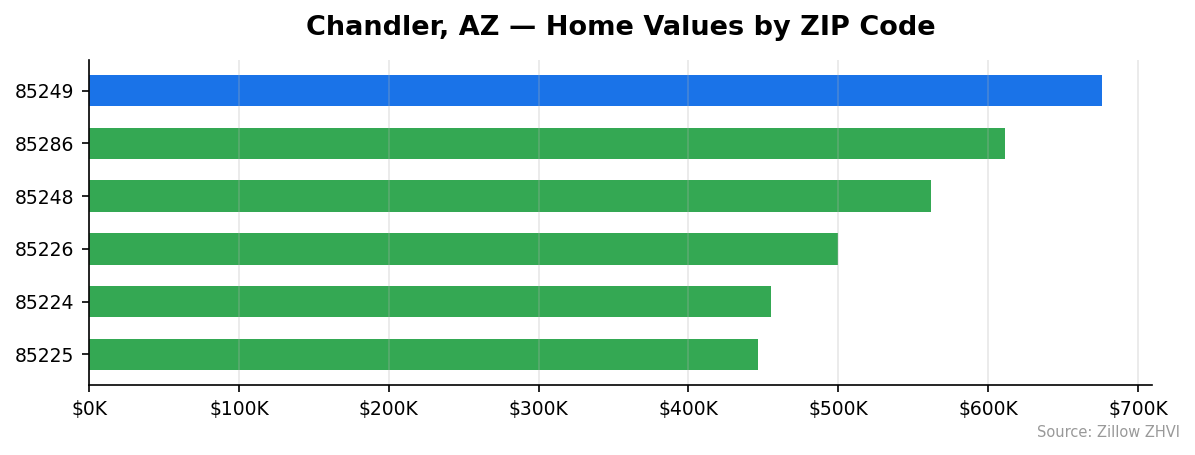
Chandler sits in the Phoenix-Mesa-Chandler metro, one of the fastest-growing regions in the country over the past decade. But growth has cooled. The city’s housing stock spans a wide range, from entry-level homes near $446K to properties topping $675K in the most expensive neighborhoods. That $229K spread across just six ZIP codes tells you Chandler isn’t one market — it’s several.
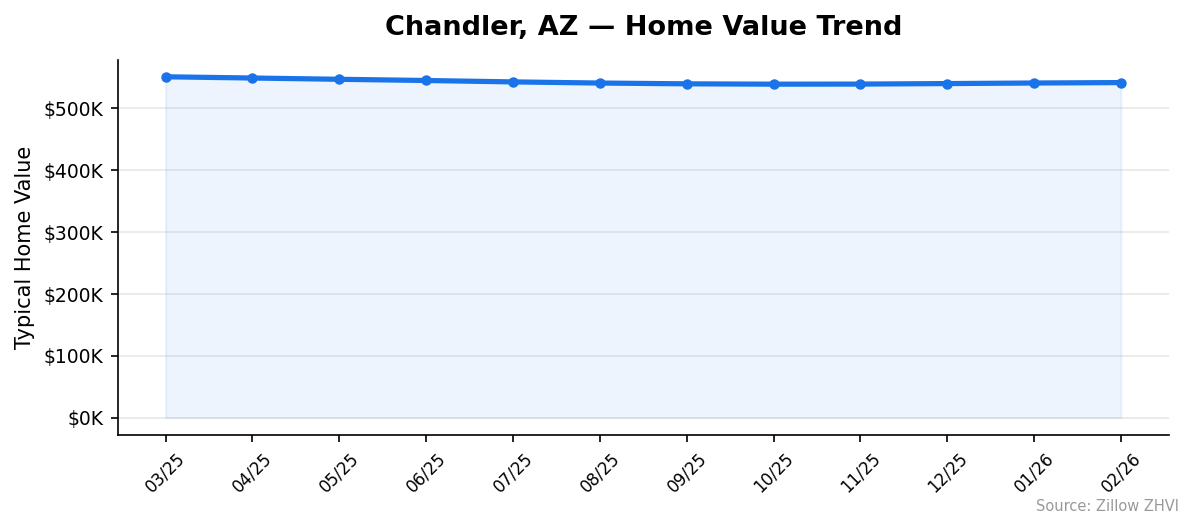
Prices bottomed out in October 2025 at $539,040, then bounced modestly through the winter. February’s $541,613 reading sits above that trough but well below the March 2025 peak of $550,968. The trend is flat with a slight upward tilt.
Chandler Home Prices by Neighborhood
Not all parts of Chandler carry the same price tag. Here’s how the six tracked ZIP codes compare:
| ZIP Code | Typical Home Value | Avg. Monthly Rent |
|---|---|---|
| 85225 | $446,247 | $1,720 |
| 85224 | $455,248 | $1,730 |
| 85226 | $499,648 | $1,803 |
| 85248 | $561,830 | $2,117 |
| 85286 | $610,918 | $1,982 |
| 85249 | $675,784 | $2,551 |
Most Expensive
85249 leads the pack at $675,784 — 25% above the city median. Rents here are the highest in Chandler at $2,551 per month, reflecting the premium nature of the housing stock.
85286 comes in at $610,918, about $69K above the city average. Interestingly, rents in this ZIP ($1,982) are lower than in 85248, suggesting more owner-occupied properties.
85248 rounds out the top three at $561,830. Rents run $2,117 per month, the second-highest in the city.
Most Affordable
85225 is the entry point into Chandler homeownership at $446,247 — nearly $100K below the city median. Rent here averages $1,720, making it the cheapest ZIP to both rent and buy.
85224 is close behind at $455,248. It shares similar rent levels with 85225, at $1,730 per month.
85226 offers a middle-ground option at $499,648. It’s the only ZIP under $500K that still sits in the geographic heart of the city, with rents at $1,803.
Rent vs Buy in Chandler
The rent-or-buy math in Chandler tilts toward renting right now, at least on a pure monthly payment basis.
The average rent across Chandler’s six ZIP codes works out to approximately $1,984 per month. A mortgage on the median $541,613 home — assuming 20% down and a 7% rate — runs about $2,882 per month for principal and interest alone. Add property taxes and insurance, and you’re looking at $3,300 or more.
That’s a $1,300+ monthly gap between renting and buying.
| ZIP Code | Monthly Rent | Est. Mortgage (P&I) | Monthly Gap |
|---|---|---|---|
| 85225 | $1,720 | $2,376 | $656 |
| 85224 | $1,730 | $2,424 | $694 |
| 85226 | $1,803 | $2,660 | $857 |
| 85248 | $2,117 | $2,991 | $874 |
| 85286 | $1,982 | $3,252 | $1,270 |
| 85249 | $2,551 | $3,597 | $1,046 |
Mortgage estimates assume 20% down payment, 7% interest rate, principal and interest only.
The gap is smallest in the affordable ZIPs — 85225 and 85224 — where the monthly difference is under $700. If you’re set on buying, those areas offer the least painful entry. In 85286, the spread balloons to over $1,200, making the rent advantage hard to ignore.
Of course, mortgage payments build equity. Rent payments don’t. But with prices still sliding year over year, that equity argument weakens.
Population Growth and Migration
Chandler’s population reached 281,231 in 2024, a 1.4% increase from 277,429 in 2020. Growth has been steady but modest.
| Year | Population | Change |
|---|---|---|
| 2020 | 277,429 | — |
| 2021 | 279,667 | +2,238 |
| 2022 | 280,996 | +1,329 |
| 2023 | 281,543 | +547 |
| 2024 | 281,231 | -312 |
The year-by-year numbers tell a story of deceleration. The city added 2,238 residents in 2021, then 1,329 in 2022, then just 547 in 2023. In 2024, the population actually dipped by 312 — the first decline in this dataset.
Compare that to other cities in the Phoenix metro:
| City | 2024 Population | 4-Year Growth |
|---|---|---|
| Goodyear | 118,186 | +20.8% |
| Surprise | 167,564 | +16.0% |
| Gilbert | 288,790 | +7.2% |
| Peoria | 199,924 | +4.1% |
| Phoenix | 1,673,164 | +3.8% |
| Chandler | 281,231 | +1.4% |
Chandler is growing the slowest among its peers. Goodyear and Surprise are absorbing new residents at 10-15x the rate. Gilbert, which is similar in size, grew at 5x Chandler’s pace.
Slower population growth means less upward pressure on housing demand. It partly explains why Chandler prices are softening while the broader metro still attracts migration.
Chandler Housing Market Trends
Here’s how the median home value has moved over the past 12 months:
| Month | Median Value | Monthly Change |
|---|---|---|
| Mar 2025 | $550,968 | — |
| Apr 2025 | $548,979 | -$1,989 |
| May 2025 | $546,931 | -$2,048 |
| Jun 2025 | $544,970 | -$1,961 |
| Jul 2025 | $542,703 | -$2,267 |
| Aug 2025 | $540,862 | -$1,841 |
| Sep 2025 | $539,590 | -$1,272 |
| Oct 2025 | $539,040 | -$550 |
| Nov 2025 | $539,177 | +$137 |
| Dec 2025 | $540,007 | +$830 |
| Jan 2026 | $540,901 | +$894 |
| Feb 2026 | $541,613 | +$712 |
The trend breaks into two phases. From March through October 2025, prices fell every single month — eight consecutive declines totaling about $11,900. Then the bleeding stopped. November marked the inflection point with a $137 gain, and prices have crept upward since.
The rate of decline slowed dramatically before the reversal. October’s drop was just $550, compared to July’s $2,267 slide. That deceleration signaled the bottom was near.
Since November, monthly gains have averaged about $640. That’s slow. It won’t recover the lost ground quickly. But the direction has clearly shifted.
Is Chandler a Good Place to Buy in 2026?
The data points to a balanced market leaning slightly in buyers’ favor.
Prices are down 1.7% year over year. That gives buyers negotiating room they didn’t have in 2022 or 2023. The eight-month price slide from March to October 2025 shook some urgency out of the market.
But the recovery — four straight months of gains — suggests the floor may be in. If you’re waiting for a bigger drop, the trend doesn’t support that bet right now.
The rent-vs-buy gap is wide. You’ll pay significantly more per month to own than to rent in every ZIP code. That makes buying a long-term play, not a short-term financial win. If you’re planning to stay five or more years, the equity build and rate-lock advantage could work in your favor. For a shorter timeline, renting makes more financial sense.
Chandler’s slower population growth compared to Goodyear, Surprise, and Gilbert is worth noting. Less demand pressure means prices are less likely to spike, but also less likely to crash — the market isn’t overheated.
Chandler Housing Market Outlook for 2026-2027
The four-month upward trend from November 2025 through February 2026 suggests prices have stabilized. Monthly gains have been consistent but small — averaging around $640 per month.
If the current pace continues through 2026, you’d expect the median to drift toward $545,000-$550,000 by late summer. That would still leave prices below the March 2025 peak of $550,968.
The 12-month trend shows a market that overcorrected downward and is now grinding back. The monthly gains are getting slightly smaller — $894 in January versus $712 in February — which hints that the recovery may plateau rather than accelerate.
Don’t expect a sharp rebound. The conditions that drove the decline — high mortgage rates and slowing population growth — haven’t changed dramatically. But barring an economic shock, the data doesn’t support a renewed downturn either.
Similar Markets in AZ
If you’re exploring options beyond Chandler, here are other Arizona markets worth comparing:
- Phoenix — The metro anchor, with 1.67 million residents and far more inventory to choose from.
- Gilbert — Chandler’s neighbor to the east, slightly larger in population and growing faster.
- Mesa — The third-largest city in the metro, typically offering lower price points than Chandler.
- Tempe — A college-town market near ASU with different demand drivers.
- Peoria — Growing at 4.1% on the metro’s west side, offering suburban alternatives.
Frequently Asked Questions
What is the average home price in Chandler?
The average home price in Chandler is $541,613 as of February 2026. Prices range from $446,247 in ZIP code 85225 to $675,784 in 85249, a spread of nearly $230,000 depending on the neighborhood.
Are home prices going up or down in Chandler?
Prices are down 1.7% compared to a year ago. However, the monthly trend reversed in November 2025. The market has posted four consecutive months of modest gains after declining from March through October 2025.
Is it cheaper to rent or buy in Chandler?
Renting is cheaper. Average monthly rent across Chandler is approximately $1,984. A mortgage on the median home at 7% with 20% down runs about $2,882 for principal and interest — roughly $900 more per month before taxes and insurance.
What is the most affordable neighborhood in Chandler?
ZIP code 85225 is the most affordable area, with a typical home value of $446,247. That’s about $95,000 below the citywide median. Rent in 85225 averages $1,720 per month, also the lowest in the city.
Methodology
Home values are based on the Zillow Home Value Index (ZHVI), a smoothed measure of typical home values in the 35th to 65th percentile range. Rent estimates use the Zillow Observed Rent Index (ZORI). Population figures come from the U.S. Census Bureau Population Estimates Program (2020-2024 vintage). All datasets are publicly available. Housing data updated 2026-02-28.