Tempe Home Prices: $506K, Down 0.9% — 4 ZIPs Analyzed (2026)
$506,230. That’s what a typical home costs in Tempe right now — and it’s actually less than it was a year ago.
The city’s housing market has cooled slightly, with prices down 0.9% year over year. For a college town wedged between Phoenix and Mesa, that small dip might surprise some buyers who assumed the East Valley only moves in one direction.
Quick answer: The average home price in Tempe, AZ is $506,230 as of February 2026, down 0.9% year over year according to Zillow.
Current Home Prices in Tempe
Tempe’s median home value landed at $506,230 in February 2026. That’s a modest decline from a year earlier, when prices sat closer to $511,000.
| Metric | Value |
|---|---|
| Median Home Value | $506,230 |
| Year-over-Year Change | -0.9% |
| Lowest ZIP Median | $401,049 |
| Highest ZIP Median | $706,954 |
| Number of ZIPs Tracked | 4 |
| Data as of | February 2026 |
The gap between the cheapest and most expensive ZIP code is $305,905. That’s a wide spread for a city of just 15 square miles. Where you buy within Tempe matters as much as whether you buy.
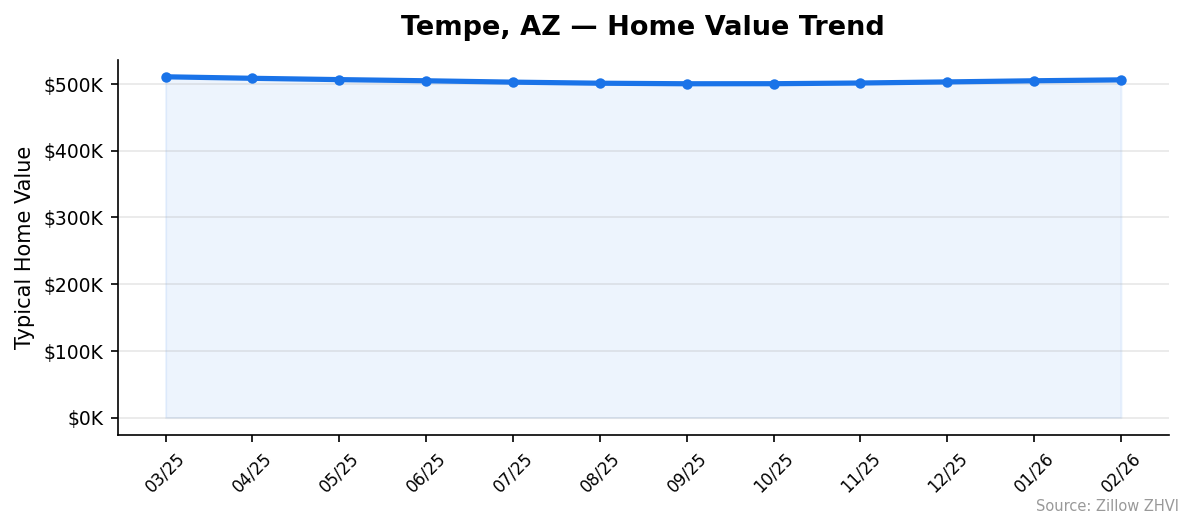
Prices peaked around March 2025 at $510,842, then softened through the summer and fall. Since September 2025, there’s been a slow crawl upward — the market isn’t crashing, but it isn’t surging either. The current median sits about $4,600 below last spring’s high.
For buyers, the takeaway is straightforward: Tempe is holding relatively steady. A 0.9% annual decline barely qualifies as a correction. The market is flat, not falling.
Tempe Home Prices by Neighborhood
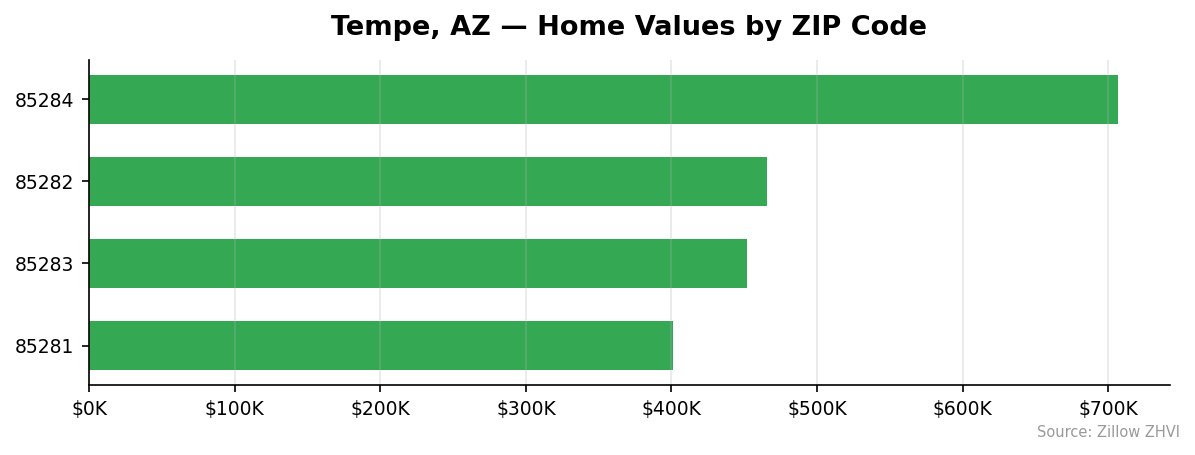
All four tracked ZIP codes tell different stories. Here’s how they compare:
| ZIP Code | Median Home Value | Median Rent |
|---|---|---|
| 85284 | $706,954 | $2,648 |
| 85282 | $465,341 | $1,754 |
| 85283 | $451,576 | $1,529 |
| 85281 | $401,049 | $1,669 |
Most Expensive
85284 leads by a wide margin at $706,954 — nearly 40% above the city median. Rents here hit $2,648/month, the highest in Tempe by far. This is south Tempe territory, and the premium shows in every metric.
Most Affordable
85281 comes in at $401,049, about 21% below the city median. This ZIP sits closest to Arizona State University’s main campus. Rent runs $1,669/month. For buyers priced out of south Tempe, this is where entry-level options exist.
85283 isn’t far behind at $451,576, and it actually has the lowest rent of any Tempe ZIP at $1,529/month.
Rent vs Buy in Tempe
Renting wins on monthly cost right now. Here’s the math.
The city-wide average rent across all four ZIPs is approximately $1,900/month. A mortgage on the median-priced home of $506,230 — assuming 20% down, a 30-year fixed rate near 7% — produces a monthly principal and interest payment of roughly $2,694. Add property taxes and insurance, and you’re looking at $3,100 or more per month.
| Scenario | Monthly Cost |
|---|---|
| Average Rent (all ZIPs) | ~$1,900 |
| Mortgage (P&I, 20% down, 7%) | ~$2,694 |
| Mortgage + Tax + Insurance (est.) | ~$3,100+ |
That’s a $1,200/month gap between renting and owning. Over a year, renting saves roughly $14,400 in cash flow.
Of course, buying builds equity. But with prices flat to slightly negative, the equity argument weakens. You’re not gaining appreciation right now — you’re paying a premium for stability and long-term ownership.
In the most affordable ZIP (85281), rent of $1,669 versus a mortgage on a $401,049 home narrows the gap. That’s the ZIP where buying gets closest to penciling out.
Population Growth and Migration
Tempe’s population reached 190,114 in 2024, up 2.6% from 185,313 in 2020. Growth has been real but unremarkable compared to other Phoenix-metro cities.
| Year | Population |
|---|---|
| 2020 | 185,313 |
| 2021 | 184,654 |
| 2022 | 189,589 |
| 2023 | 190,651 |
| 2024 | 190,114 |
The city actually lost residents between 2020 and 2021, then rebounded sharply in 2022 with nearly 5,000 new residents. Growth has since flattened. The 2024 number dipped slightly from 2023’s peak.
Compare that to the rest of the metro:
| City | 2024 Population | 4-Year Growth |
|---|---|---|
| Goodyear | 118,186 | 20.8% |
| Surprise | 167,564 | 16.0% |
| Gilbert | 288,790 | 7.2% |
| Peoria | 199,924 | 4.1% |
| Phoenix | 1,673,164 | 3.8% |
| Tempe | 190,114 | 2.6% |
Tempe is growing the slowest in this group. That’s partly because it’s already built out — there’s less raw land for new subdivisions. Goodyear and Surprise are absorbing the sprawl growth. For housing demand, Tempe’s slower population growth means less upward pressure on prices compared to the outer suburbs.
Tempe Housing Market Trends
Here’s how the median home value moved over the past 12 months:
| Month | Median Value | Min ZIP | Max ZIP |
|---|---|---|---|
| Feb 2026 | $506,230 | $401,049 | $706,954 |
| Jan 2026 | $504,879 | $401,397 | $703,810 |
| Dec 2025 | $503,154 | $401,104 | $700,394 |
| Nov 2025 | $501,511 | $400,815 | $697,399 |
| Oct 2025 | $500,483 | $400,380 | $695,644 |
| Sep 2025 | $500,392 | $400,632 | $695,012 |
| Aug 2025 | $501,204 | $401,521 | $695,395 |
| Jul 2025 | $502,815 | $403,017 | $696,724 |
| Jun 2025 | $504,875 | $405,126 | $698,178 |
| May 2025 | $506,599 | $406,917 | $699,153 |
| Apr 2025 | $508,580 | $409,075 | $700,030 |
| Mar 2025 | $510,842 | $411,127 | $701,579 |
The pattern is clear: prices slid from March through September 2025, losing about $10,450 from peak to trough. Then a slow recovery began. The last five months show consecutive monthly gains, though small ones — roughly $1,000-$1,500 per month.
The floor ZIP (85281) has been remarkably stable, hovering near $401,000 for the entire period. Meanwhile, the ceiling ZIP (85284) swung from $701,579 down to $695,012 and back up to $706,954. The expensive end of Tempe is more volatile.
Is Tempe a Good Place to Buy in 2026?
The data points to a balanced market. Prices are essentially flat year over year — down 0.9%, which is statistical noise. Neither buyers nor sellers have the upper hand.
For buyers, the upside is that you’re not chasing a runaway market. The urgency that defined 2021-2022 is gone. You can negotiate. You can wait a month without getting priced out.
The downside: you’re paying $506,230 for the median home, which translates to roughly $3,100/month all-in. That’s a high bar, especially when renting the same area costs $1,900.
Tempe works best for buyers who plan to hold for 5+ years and value the location — ASU proximity, light rail access, central East Valley position. Short-term flippers will find nothing to work with here. The margins are too thin.
If you need the most affordable entry point, focus on ZIP 85281 at $401,049. That’s $100,000 below the city median.
Tempe Housing Market Outlook for 2026-2027
The last five months of data show a gentle upward trend, with prices climbing from $500,392 in September 2025 to $506,230 in February 2026. That’s a 1.2% gain over five months.
If the current pace continues, Tempe could see prices in the $510,000-$515,000 range by late summer 2026 — essentially returning to where they were in spring 2025. The three-month trend suggests acceleration is unlikely. Monthly gains have been modest and consistent, not explosive.
Population growth has flattened, which limits demand-side pressure. But Tempe’s land constraints limit new supply too. The most likely scenario for the rest of 2026 is more of the same: slow, steady movement within a narrow band.
Don’t expect a breakout in either direction.
Similar Markets in AZ
If you’re exploring options across Arizona, these cities offer different price points:
- Chandler — Tempe’s neighbor to the south, another East Valley market worth comparing directly.
- Mesa — Borders Tempe to the east and typically offers lower price points with more inventory.
- Phoenix — The metro anchor. Much larger market with wider price variation across its many neighborhoods.
- Gilbert — Southeast Valley suburb that’s grown 7.2% since 2020 and draws many of the same buyers.
- Surprise — West Valley option with 16% population growth and generally lower home prices.
Frequently Asked Questions
What is the average home price in Tempe?
The average home price in Tempe is $506,230 as of February 2026. Prices vary widely by ZIP code — from $401,049 in 85281 to $706,954 in 85284. The city-wide median has decreased 0.9% compared to one year ago.
Are home prices going up or down in Tempe?
Year over year, Tempe prices are down 0.9%. But the short-term trend tells a different story. Prices bottomed in September 2025 at $500,392 and have risen for five consecutive months since then. The decline has stalled and a slow recovery appears underway.
Is it cheaper to rent or buy in Tempe?
Renting is significantly cheaper right now. The average rent across Tempe’s four ZIP codes runs about $1,900/month. A mortgage payment on the median home — with 20% down at 7% — costs roughly $2,694 in principal and interest alone. After taxes and insurance, you’re over $3,100/month. That’s a $1,200 gap.
What is the most affordable neighborhood in Tempe?
ZIP code 85281 is Tempe’s most affordable area with a median home value of $401,049 — about $105,000 below the city-wide median. Rent in 85281 averages $1,669/month. This area is closest to ASU’s main campus and offers the lowest entry point for buyers.
Methodology
Home values are based on the Zillow Home Value Index (ZHVI), a smoothed measure of typical home values in the 35th to 65th percentile range. Rent estimates use the Zillow Observed Rent Index (ZORI). Population figures come from the U.S. Census Bureau Population Estimates Program (2020-2024 vintage). All datasets are publicly available. Housing data updated 2026-02-28.