Peoria Home Prices: $477K, Down 1.5% — 4 ZIPs Analyzed (2026)
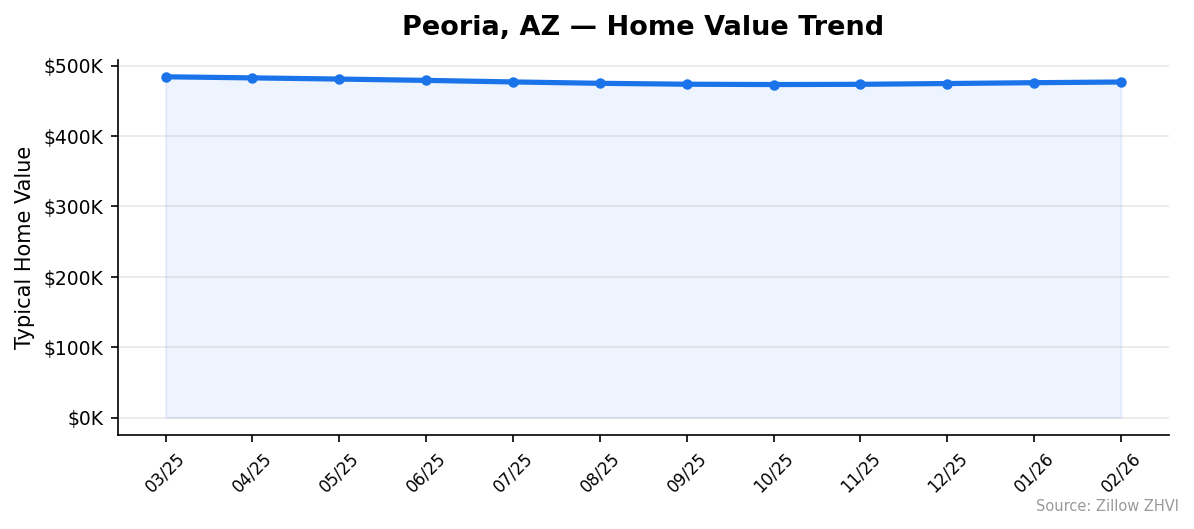
$476,784. That’s what a typical home costs in Peoria right now. A year ago it was higher. Prices have slipped 1.5%, and the slide has been steady — eleven months of gradual decline from a March 2025 peak.
Quick answer: The average home price in Peoria, AZ is $476,784 as of February 2026, down 1.5% year over year according to Zillow.
Current Home Prices in Peoria
| Metric | Value |
|---|---|
| Median Home Price | $476,784 |
| Year-over-Year Change | -1.5% |
| Lowest ZIP Median | $363,661 |
| Highest ZIP Median | $638,054 |
| Number of ZIPs Tracked | 4 |
| Data As Of | February 2026 |
The median sits just under $477K, placing Peoria above the Phoenix metro’s cheaper suburbs but well below the priciest parts of Scottsdale or Paradise Valley. The $274K gap between the cheapest and most expensive ZIP tells you that “Peoria” is not one market — it’s at least two.
A 1.5% annual decline works out to roughly $7,300 in lost value on a median-priced home. That’s not a crash. But it reverses the gains from late 2024 and early 2025, when prices briefly pushed past $484K.
Buyers have more bargaining power than they did a year ago. Sellers who bought before 2022 are still sitting on large equity gains, but anyone who purchased near the 2025 peak may be underwater on transaction costs if they tried to sell today.
Peoria Home Prices by Neighborhood
| ZIP Code | Median Home Value | Median Rent |
|---|---|---|
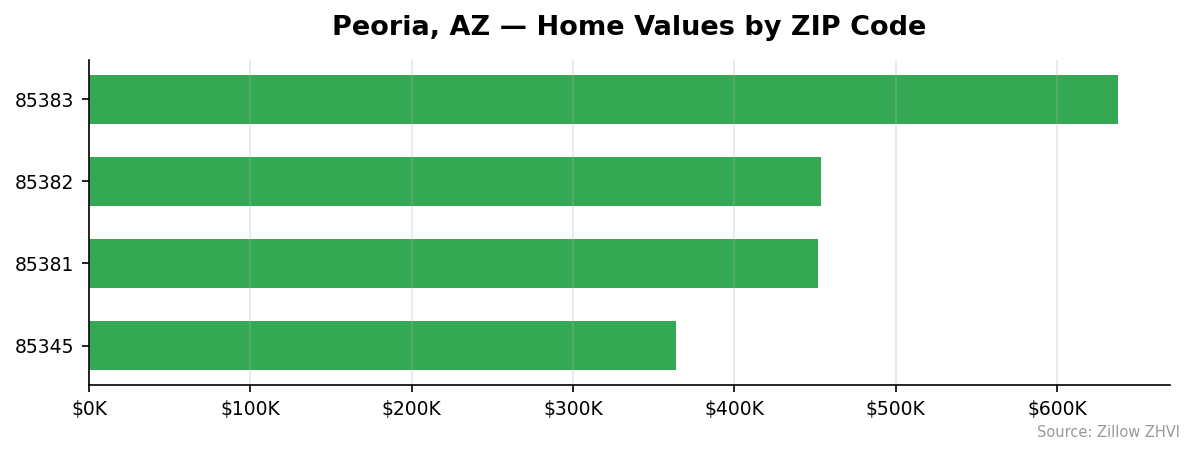
| 85383 | $638,054 | $2,191/mo |
| 85382 | $453,400 | $1,807/mo |
| 85381 | $452,020 | $1,506/mo |
| 85345 | $363,661 | $1,774/mo |
Most Expensive
85383 leads at $638,054 — 34% above the city median. Rents here are the highest in Peoria at $2,191/month, which tracks with the premium home values.
Most Affordable
85345 comes in at $363,661, roughly $113K below the city average. Despite being the cheapest area to buy, rents in 85345 run $1,774/month — only $33 less than 85382, which has homes worth $90K more.
85381 offers an interesting middle ground: home values of $452,020 but the lowest rents in the city at $1,506/month.
Rent vs Buy in Peoria
The average rent across Peoria’s four tracked ZIPs is approximately $1,819/month. Here’s how that compares to buying.
| Scenario | Monthly Cost |
|---|---|
| Median Rent | ~$1,819 |
| Mortgage (20% down, 6.5%, 30yr) | ~$2,413 |
| Mortgage (10% down, 6.5%, 30yr) | ~$2,715 |
| Difference (20% down) | ~$594/mo |
A 20% down payment on a $477K home means $95,400 upfront and a loan of about $381,400. At 6.5%, that’s roughly $2,413/month before taxes and insurance.
Renting saves you about $594/month in pure housing cost — and that’s before you factor in property taxes, HOA fees, insurance, and maintenance. On a cash-flow basis, renting wins right now.
But there’s a catch. If you plan to stay five-plus years and prices stabilize, the equity you build through mortgage payments could offset the monthly premium. The math flips faster if rates drop.
Rent varies sharply by ZIP. In 85381, you’d pay just $1,506/month to rent. In 85383, it’s $2,191.
Population Growth and Migration
Peoria’s population reached 199,924 in 2024, up 4.1% from 191,989 in 2020. The city is closing in on the 200,000 mark.
| Year | Population |
|---|---|
| 2020 | 191,989 |
| 2021 | 194,946 |
| 2022 | 197,869 |
| 2023 | 199,649 |
| 2024 | 199,924 |
Growth has slowed. Peoria added nearly 3,000 residents per year in 2021 and 2022, but the pace dropped to 1,780 in 2023 and just 275 in 2024. The city is still growing — but barely.
Compare that to neighbors in the Phoenix metro:
| City | 2024 Population | 4-Year Growth |
|---|---|---|
| Goodyear | 118,186 | 20.8% |
| Surprise | 167,564 | 16.0% |
| Gilbert | 288,790 | 7.2% |
| Phoenix | 1,673,164 | 3.8% |
| Glendale | 258,143 | 3.7% |
| Peoria | 199,924 | 4.1% |
Goodyear and Surprise are absorbing far more newcomers, which means those markets face stronger demand pressure. Peoria’s slower growth helps explain why prices are softening here while some outer suburbs hold firm.
Peoria Housing Market Trends
| Month | Avg Home Value | Low (ZIP) | High (ZIP) |
|---|---|---|---|
| Mar 2025 | $484,191 | $374,573 | $639,220 |
| Apr 2025 | $482,647 | $372,616 | $639,113 |
| May 2025 | $480,959 | $370,674 | $638,523 |
| Jun 2025 | $479,086 | $368,793 | $637,228 |
| Jul 2025 | $476,877 | $366,811 | $634,849 |
| Aug 2025 | $474,930 | $364,953 | $632,834 |
| Sep 2025 | $473,635 | $363,526 | $631,717 |
| Oct 2025 | $473,166 | $362,472 | $632,010 |
| Nov 2025 | $473,507 | $362,142 | $633,382 |
| Dec 2025 | $474,620 | $362,396 | $635,513 |
| Jan 2026 | $475,798 | $362,958 | $637,205 |
| Feb 2026 | $476,784 | $363,661 | $638,054 |
The trend breaks into two phases. From March through October 2025, prices fell steadily — dropping $11K over seven months. Then in November, the decline reversed. Values have ticked up for four straight months, gaining about $3,600 since the October low of $473,166.
The floor ZIP (85345) bottomed at $362,142 in November before recovering slightly. The ceiling ZIP (85383) peaked at $639,220 in March 2025 and nearly matched that at $638,054 in February 2026.
Is Peoria a Good Place to Buy in 2026?
The numbers point to a balanced market leaning slightly toward buyers. Prices are down year over year, population growth has stalled, and renting is cheaper on a monthly basis. That gives you negotiating room.
On the other hand, the four-month uptick since October 2025 suggests the correction may be ending. You’re not catching a falling knife — you’re buying during a soft landing.
If you’re looking at the affordable end, 85345 offers entry below $364K in a metro where the median is far higher. If you want more home and can handle a larger payment, 85383 gives you top-tier Peoria real estate near $638K.
The rent-vs-buy gap means you shouldn’t rush. Take your time, compare neighborhoods, and make sure the monthly payment works at current rates.
Peoria Housing Market Outlook for 2026-2027
The last four months show a modest recovery: prices climbed from $473,166 in October to $476,784 in February, a gain of about $900/month. If that pace holds through 2026, Peoria could end the year near $483K — roughly back to where it was in early 2025.
But the gains are small. A $900/month increase is well below the rate of decline earlier in 2025, when values dropped $1,500/month between March and October. The market has stabilized more than it has rebounded.
The three-month trend from December through February suggests steady, slow appreciation. Barring a significant change in mortgage rates or local employment, expect prices to hover in the $475K–$485K range through late 2026.
Similar Markets in AZ
If you’re shopping Peoria, these Arizona cities offer useful comparisons:
- Phoenix — the metro anchor with 1.67 million residents and similar growth trends to Peoria
- Glendale — borders Peoria to the south and shares several ZIP code boundaries
- Surprise — fast-growing neighbor to the west with 16% population growth since 2020
- Chandler — east Valley alternative with a strong tech-job base
- Gilbert — another east Valley suburb with 7.2% population growth
Frequently Asked Questions
What is the average home price in Peoria?
The average home price in Peoria, AZ is $476,784 as of February 2026. Prices range from $363,661 in ZIP code 85345 to $638,054 in 85383. That’s a spread of over $274K depending on where in the city you buy.
Are home prices going up or down in Peoria?
Prices are down 1.5% compared to a year ago. They peaked at $484,191 in March 2025 and declined through October, but have recovered slightly over the past four months. The overall trajectory is a mild correction, not a steep drop.
Is it cheaper to rent or buy in Peoria?
Renting is cheaper right now. The average rent across Peoria’s ZIPs is about $1,819/month. A mortgage on the median home with 20% down at 6.5% runs roughly $2,413/month — that’s $594 more per month before taxes and insurance. The gap narrows in 85381, where rent is just $1,506.
What is the most affordable neighborhood in Peoria?
ZIP code 85345 has the lowest median home value at $363,661. That’s 24% below the city average. Rent in 85345 is $1,774/month, making it a relatively affordable area on both the buying and renting side.
Methodology
Home values are based on the Zillow Home Value Index (ZHVI), a smoothed measure of typical home values in the 35th to 65th percentile range. Rent estimates use the Zillow Observed Rent Index (ZORI). Population figures come from the U.S. Census Bureau Population Estimates Program (2020-2024 vintage). All datasets are publicly available. Housing data updated 2026-02-28.