Mesa Home Prices: $441K, Down 1.8% — 13 ZIPs Analyzed (2026)
$440,581. That’s what a typical home costs in Mesa right now. Prices are down 1.8% from a year ago, marking nearly a full year of slow decline. For buyers watching this market, the question isn’t whether prices are falling — it’s whether they’ll keep falling.
Quick answer: The average home price in Mesa, AZ is $440,581 as of February 2026, down 1.8% year over year according to Zillow.
Current Home Prices in Mesa
Mesa sits in the Phoenix-Mesa-Chandler metro area, Arizona’s largest housing market. Here’s where things stand:
| Metric | Value |
|---|---|
| Median Home Value | $440,581 |
| Year-over-Year Change | -1.8% |
| Lowest ZIP Price | $358,237 |
| Highest ZIP Price | $558,988 |
| Number of ZIPs Tracked | 13 |
| Data as of | February 2026 |
That 1.8% annual decline works out to roughly $8,100 in lost value on the median home. Not a crash, but not the appreciation homeowners got used to during the pandemic years either.
The spread between the cheapest and most expensive ZIP codes is just over $200,000. That’s a wide gap for a single city, and it means your experience of the Mesa market depends heavily on where you’re looking. A buyer in 85201 faces a completely different reality than someone shopping in 85212.
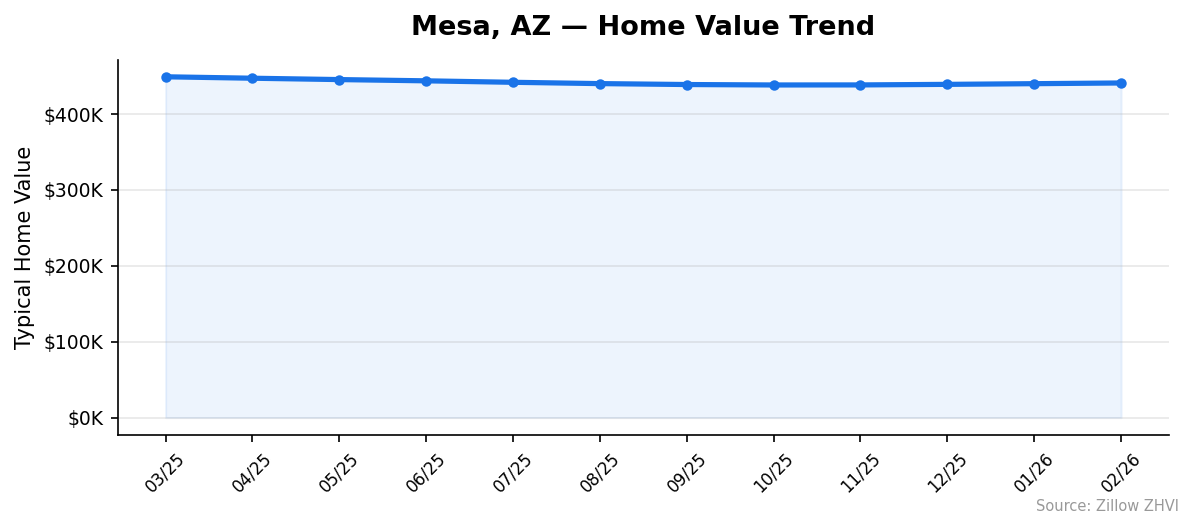
Prices bottomed in October 2025 at $437,942 and have ticked up slightly since then. February’s reading of $440,581 is about $2,600 above that trough. Whether this is a real rebound or seasonal noise remains to be seen.
Mesa Home Prices by Neighborhood
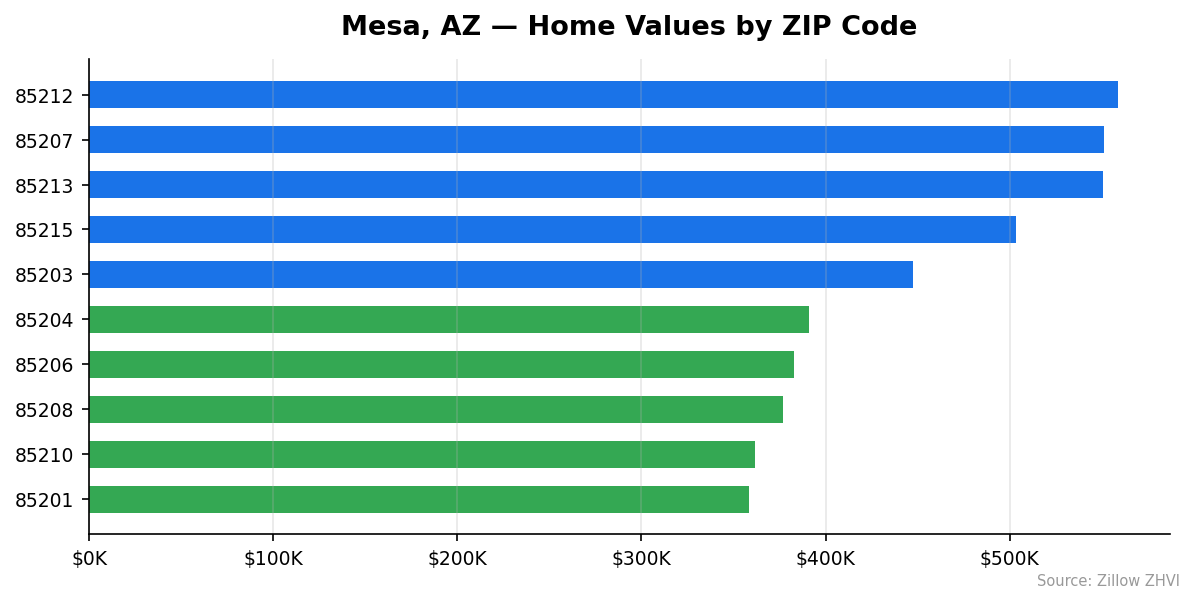
All 13 Mesa ZIP codes, ranked from most to least expensive:
| ZIP Code | Median Home Value | Avg Monthly Rent |
|---|---|---|
| 85212 | $558,988 | $2,194 |
| 85207 | $551,288 | $2,175 |
| 85213 | $550,629 | $1,489 |
| 85215 | $503,657 | $1,930 |
| 85203 | $447,264 | $1,395 |
| 85209 | $443,733 | $1,943 |
| 85205 | $404,331 | $1,879 |
| 85202 | $397,023 | $1,341 |
| 85204 | $390,790 | $1,502 |
| 85206 | $382,911 | $1,601 |
| 85208 | $377,033 | $1,929 |
| 85210 | $361,670 | $1,389 |
| 85201 | $358,237 | $1,354 |
Most Expensive ZIPs
85212 leads the city at $558,988 with rents to match at $2,194/month — 27% above the city median. 85207 is close behind at $551,288, the second-priciest area with similarly high rents of $2,175/month. 85213 rounds out the top three at $550,629, though its rent of $1,489/month is strikingly low relative to home values, suggesting more owner-occupied homes.
Most Affordable ZIPs
85201 is the cheapest entry point at $358,237 — nearly $200,000 less than the priciest ZIP and 19% below the city median. 85210 comes in at $361,670 with rent at $1,389/month, making it affordable on both sides of the rent-or-buy equation. 85208 at $377,033 rounds out the bottom three, though its rent of $1,929/month is among the highest in the city — a mismatch worth noting if you’re comparing costs.
Rent vs Buy in Mesa
The math favors renters right now.
The citywide average rent across all 13 ZIP codes is approximately $1,702/month. A mortgage on the median-priced home of $440,581 — assuming 20% down, a 7% rate on a 30-year fixed loan — comes to about $2,345/month in principal and interest alone. Add property taxes and insurance and you’re looking at roughly $2,700/month.
That’s a gap of about $1,000 per month.
| Cost Comparison | Monthly |
|---|---|
| Average Rent (all ZIPs) | ~$1,702 |
| Estimated Mortgage (P&I) | ~$2,345 |
| Estimated Total (with tax/insurance) | ~$2,700 |
| Monthly Premium to Buy | ~$1,000 |
The gap narrows in cheaper areas. In 85201, rent runs $1,354/month. A mortgage on a $358,237 home (same terms) works out to about $1,905/month in P&I, or around $2,250 all-in. Still more expensive than renting, but the difference shrinks to roughly $900.
Buying only makes financial sense right now if you’re planning to hold for many years and expect prices to recover. With values still drifting lower, there’s no short-term equity upside to offset that monthly premium.
Population Growth and Migration
Mesa is the third-largest city in Arizona and it’s still growing.
| Year | Population |
|---|---|
| 2020 | 505,950 |
| 2021 | 509,284 |
| 2022 | 512,545 |
| 2023 | 513,993 |
| 2024 | 517,151 |
The city added 11,201 residents between 2020 and 2024, a 2.2% increase. Growth has been steady but not explosive — roughly 2,800 new residents per year.
Compare that to other cities in the Phoenix metro:
| City | 2024 Population | 4-Year Growth |
|---|---|---|
| Phoenix | 1,673,164 | 3.8% |
| Gilbert | 288,790 | 7.2% |
| Peoria | 199,924 | 4.1% |
| Surprise | 167,564 | 16.0% |
| Goodyear | 118,186 | 20.8% |
| Mesa | 517,151 | 2.2% |
Mesa’s growth rate is the slowest on this list. The faster-growing cities — Goodyear at 20.8% and Surprise at 16.0% — are smaller and further from the metro core. Mesa is a mature city. It’s gaining people, but not at a pace that creates intense housing demand.
That matters for prices. Slower population growth means less upward pressure on home values compared to the booming suburbs to the west.
Mesa Housing Market Trends
Here’s how prices moved month by month over the past year:
| Month | Avg Home Value | Low | High |
|---|---|---|---|
| Mar 2025 | $448,719 | $371,524 | $565,400 |
| Apr 2025 | $446,828 | $368,907 | $563,964 |
| May 2025 | $445,038 | $366,489 | $562,242 |
| Jun 2025 | $443,397 | $364,328 | $560,563 |
| Jul 2025 | $441,462 | $362,061 | $558,639 |
| Aug 2025 | $439,743 | $359,901 | $557,134 |
| Sep 2025 | $438,532 | $358,393 | $556,269 |
| Oct 2025 | $437,942 | $357,537 | $555,928 |
| Nov 2025 | $438,013 | $357,313 | $556,346 |
| Dec 2025 | $438,748 | $357,515 | $557,232 |
| Jan 2026 | $439,649 | $357,830 | $558,204 |
| Feb 2026 | $440,581 | $358,237 | $558,988 |
The pattern is clear. Prices fell steadily from March through October 2025, dropping $10,777 over seven months. The slide hit bottom in October at $437,942.
Since then, values have crept upward for four straight months. The rebound has been modest — $2,639 from October to February — but it’s consistent. Both the floor and ceiling of the market moved in the same direction, suggesting the recovery isn’t limited to one price tier.
The most expensive ZIPs went from $565,400 in March 2025 to $555,928 in October before climbing back to $558,988. The cheapest ZIPs followed a similar arc, bottoming at $357,313 in November.
Is Mesa a Good Place to Buy in 2026?
The data points to a buyer-friendly market, but not a fire sale.
Prices are down 1.8% year over year. That gives you more negotiating power than you’d have had in 2024. The four months of slow recovery since October suggest the floor may be in, which reduces the risk of buying into a falling market.
The $200,000 spread across ZIP codes means you have options. A first-time buyer priced out of 85212 can find something in 85201 for $200,000 less. That flexibility is one of Mesa’s strengths as a market.
The rent-vs-buy math still favors renting in the short term. If you need to own for less than five years, the monthly premium over renting is hard to justify with flat or declining appreciation. If you’re staying long-term and can handle the higher monthly cost, the recent stabilization is an encouraging sign.
Mesa’s 2.2% population growth keeps a floor under demand. People are still moving here. They’re just not arriving fast enough to push prices upward in a meaningful way.
Mesa Housing Market Outlook for 2026-2027
The last four months show a slow but steady recovery. From October 2025 to February 2026, prices climbed about $660/month on average. If that pace continues, the citywide median could reach $444,000–$445,000 by mid-2026.
Don’t expect a sharp rebound. The recovery so far has been gradual, and the year-over-year number is still negative. Mesa needs several more months of gains before annual comparisons turn positive.
The 3-month trend from December to February — an increase of about $1,833 — suggests mild upward momentum heading into spring. Historically, spring and summer bring more buyer activity, which could support or accelerate the current pace.
The biggest risk to this outlook is mortgage rates. If rates stay near current levels, the slow recovery likely holds. A rate spike could stall it. A meaningful drop in rates would bring more buyers off the sidelines and push prices higher.
Similar Markets in AZ
If you’re considering Mesa, these nearby Arizona cities offer different price points and growth profiles:
- Phoenix — The metro anchor. Mesa buyers priced out of central Phoenix may find more space here for similar money.
- Chandler — Mesa’s neighbor to the south with a strong tech employment base. Worth comparing if you work in the east valley.
- Gilbert — Growing 7.2% over four years, Gilbert draws families looking for newer construction.
- Tempe — Smaller and closer to ASU. Typically pricier per square foot than Mesa.
- Surprise — Growing at 16% and further from the core. A good comparison if you’re flexible on commute distance.
Frequently Asked Questions
What is the average home price in Mesa?
The average home price in Mesa is $440,581 as of February 2026. That ranges from $358,237 in ZIP code 85201 to $558,988 in 85212. Where you buy within the city matters as much as the citywide number.
Are home prices going up or down in Mesa?
Down 1.8% year over year. Prices declined from March through October 2025, then reversed course with four consecutive months of small gains. The market is stabilizing but hasn’t fully recovered to early 2025 levels.
Is it cheaper to rent or buy in Mesa?
Renting is cheaper. The average rent across Mesa’s 13 ZIP codes is approximately $1,702/month. A mortgage on the median home runs about $2,700/month including taxes and insurance — roughly $1,000 more per month than renting.
What is the most affordable neighborhood in Mesa?
ZIP code 85201 in western Mesa has the lowest median home value at $358,237. Rent there averages $1,354/month, making it the most affordable area on both sides of the equation. ZIP 85210 at $361,670 is the next cheapest option.
Methodology
Home values are based on the Zillow Home Value Index (ZHVI), a smoothed measure of typical home values in the 35th to 65th percentile range. Rent estimates use the Zillow Observed Rent Index (ZORI). Population figures come from the U.S. Census Bureau Population Estimates Program (2020-2024 vintage). All datasets are publicly available. Housing data updated 2026-02-28.