Des Moines Home Prices: $225K, Up 0.8% — 11 ZIPs Analyzed (2026)
$224,776. That’s the typical home value in Des Moines, IA as of February 2026. Prices climbed 0.8% over the past year — barely moving, but moving up.
Quick answer: The average home price in Des Moines, IA is $224,776 as of February 2026, up 0.8% year over year according to Zillow.
Current Home Prices in Des Moines
The Des Moines market sits well below the national median. Of the 11 ZIPs tracked inside the city, the cheapest typical home runs $156,823 and the most expensive sits at $348,761. That spread — about $192,000 between the floor and the ceiling — is wider than the city’s overall median.
| Metric | Value |
|---|---|
| Median home value | $224,776 |
| Year-over-year change | +0.8% |
| Lowest ZIP value | $156,823 |
| Highest ZIP value | $348,761 |
| Price range (max − min) | $191,938 |
| ZIPs analyzed | 11 |
| Data as of | February 2026 |
A 0.8% gain over 12 months is essentially flat. After inflation, buyers in Des Moines saw real prices fall slightly. That’s a different story from what hot Sun Belt markets posted, and a different story from what sellers in Des Moines saw from 2020 through 2022.
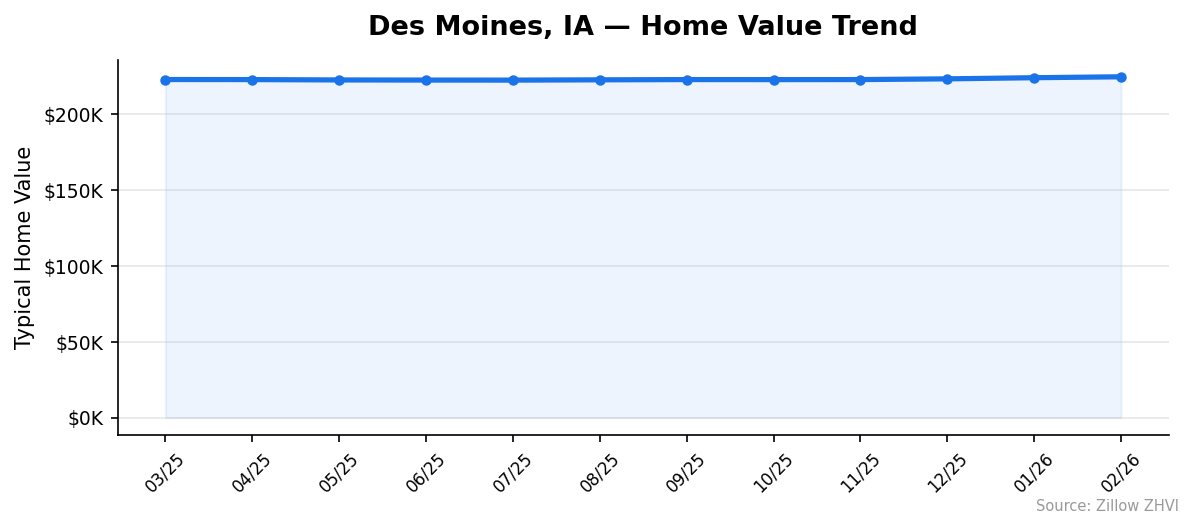
The city has settled into a low-volatility pattern. Monthly values barely shifted between summer 2025 and early 2026 — the typical home value moved by less than $3,000 across that six-month window. For buyers, that means less pressure to act. For sellers, it means setting a realistic price matters more than waiting for appreciation.
Des Moines Home Prices by Neighborhood
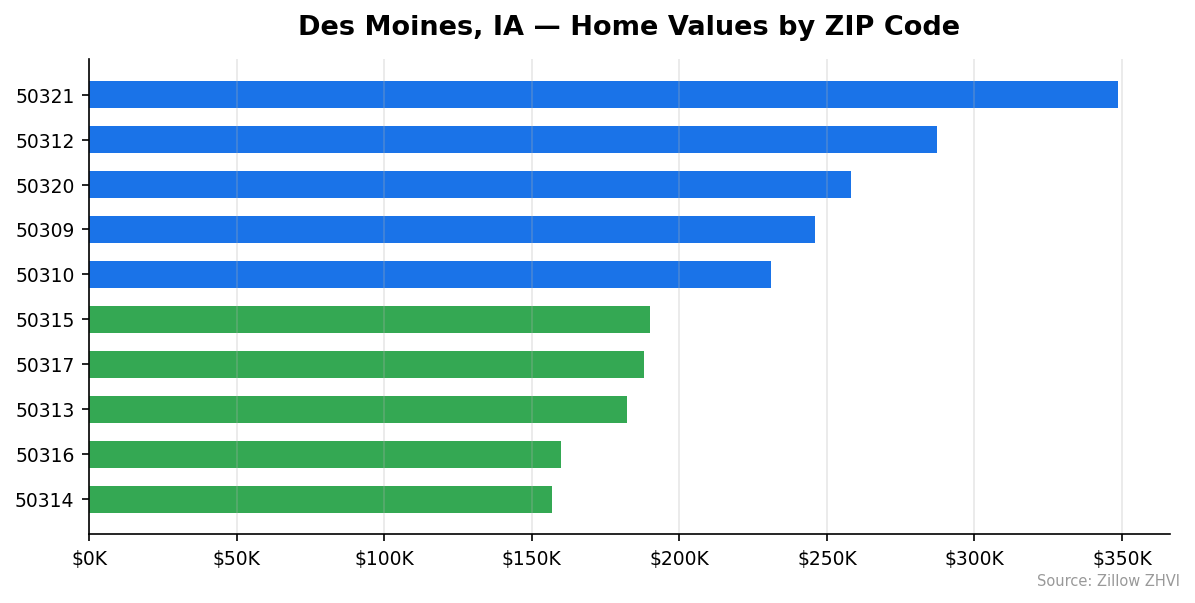
Eleven ZIP codes split Des Moines into very different price tiers. The cheapest area costs less than half what the priciest one does.
| ZIP | Typical Home Value | vs City Median |
|---|---|---|
| 50321 | $348,761 | +55% |
| 50312 | $287,312 | +28% |
| 50320 | $258,019 | +15% |
| 50309 | $245,920 | +9% |
| 50310 | $230,903 | +3% |
| 50311 | $224,623 | 0% |
| 50315 | $189,997 | −15% |
| 50317 | $188,052 | −16% |
| 50313 | $182,304 | −19% |
| 50316 | $159,826 | −29% |
| 50314 | $156,823 | −30% |
Most Expensive
- 50321 at $348,761 — the priciest ZIP in the city, sitting 55% above the city median.
- 50312 at $287,312 — typical homes here cost about $63,000 more than the city average, while rent stays modest at $1,019.
- 50320 at $258,019 — a step down, with the highest rent of any priced tier at $1,337.
Most Affordable
- 50314 at $156,823 — the cheapest ZIP, with rent averaging $919, the lowest in the city.
- 50316 at $159,826 — a near-twin to 50314 on price, but rent jumps to $1,498, the highest rent reading of any Des Moines ZIP.
- 50313 at $182,304 — sits 19% below the median, with rent under $1,075.
The 50316 mismatch is worth a second look. Buy-side prices are low. Rent is the highest in the city. That gap usually points to a strong rental investor pool relative to owner-occupiers.
Rent vs Buy in Des Moines
Rent across Des Moines ZIPs runs from about $919 in 50314 to $1,498 in 50316. The citywide range covers a rough average near $1,150 to $1,200 a month for a typical rental.
| ZIP | Typical Home | Typical Rent |
|---|---|---|
| 50316 | $159,826 | $1,498 |
| 50320 | $258,019 | $1,337 |
| 50309 | $245,920 | $1,320 |
| 50317 | $188,052 | $1,242 |
| 50315 | $189,997 | $1,103 |
| 50310 | $230,903 | $1,079 |
| 50313 | $182,304 | $1,073 |
| 50312 | $287,312 | $1,019 |
| 50311 | $224,623 | $972 |
| 50314 | $156,823 | $919 |
A $224,776 home with 10% down at a 7% mortgage rate produces a principal-and-interest payment around $1,346 a month. Add property tax (Iowa runs about 1.5%) and insurance, and the monthly carry pushes close to $1,800.
Rent on a typical unit in most ZIPs sits between $920 and $1,250. That makes renting cheaper than owning in nearly every Des Moines neighborhood today, even before maintenance costs hit.
The picture flips only in 50316, where rent at $1,498 nearly matches what a mortgage on the same area’s $159,826 typical home would cost. Investors and long-term owners willing to look there can run the math more aggressively.
Population Growth and Migration
Des Moines proper is shrinking — slowly. The city held 213,769 residents in 2020 and 213,096 in 2024, a 0.3% loss across four years. The suburbs tell the opposite story.
| Year | Population |
|---|---|
| 2020 | 213,769 |
| 2021 | 212,539 |
| 2022 | 210,950 |
| 2023 | 211,088 |
| 2024 | 213,096 |
The 2022 dip nearly took 3,000 residents off the rolls. The city has rebuilt some of that since, but it still sits below its 2020 mark.
| City | 2024 Population | 4-Year Growth |
|---|---|---|
| Ankeny | 76,727 | +11.9% |
| West Des Moines | 73,664 | +6.9% |
| Ames | 69,026 | +3.8% |
| Iowa City | 76,710 | +2.4% |
| Sioux City | 86,875 | +1.1% |
| Des Moines | 213,096 | −0.3% |
Ankeny’s 11.9% gain over four years is real growth. So is West Des Moines at 6.9%. Buyers chasing newer construction and faster-appreciating areas are voting with their addresses, and they’re voting suburban. For Des Moines housing demand inside the city limits, that means less pressure on prices and a slower pace of appreciation. The 0.8% YoY price move tracks with the demographic story.
Des Moines Housing Market Trends
The 12-month price chart looks almost flat. Values bottomed near $222,581 in July 2025 and have crept up since.
| Month | Avg Home Value |
|---|---|
| 2026-02 | $224,776 |
| 2026-01 | $224,165 |
| 2025-12 | $223,416 |
| 2025-11 | $222,940 |
| 2025-10 | $222,914 |
| 2025-09 | $222,937 |
| 2025-08 | $222,767 |
| 2025-07 | $222,581 |
| 2025-06 | $222,614 |
| 2025-05 | $222,688 |
| 2025-04 | $222,928 |
| 2025-03 | $222,983 |
Two stories sit inside this table. From March through October 2025, values barely moved — a $69 change across seven months. Then, from October 2025 through February 2026, the trend shifted up. Each month added between $26 and $749. The most recent four months gained $1,862 in total.
That’s not a boom. It’s a market with a small but consistent upward bias. Buyers waiting for a price drop have been waiting in the wrong direction.
Is Des Moines a Good Place to Buy in 2026?
The numbers point to a balanced market leaning slightly toward buyers in the lower ZIPs and slightly toward sellers up top.
Affordability is the strongest argument. A $224,776 typical home value puts Des Moines well under the national median, and ZIPs like 50314 and 50316 give first-time buyers entry points under $160,000. That’s rare in 2026.
The weak case for buying is appreciation. Des Moines posted 0.8% YoY growth while suburban neighbors like Ankeny pulled in residents at 11.9% over four years. If you’re buying primarily as an investment and want price gains, the suburbs are doing better.
If you plan to live in the home for at least five to seven years, the math works. Rent versus buy favors renting on a one-year basis but flips for owners on longer horizons. Just don’t expect quick equity gains.
Des Moines Housing Market Outlook for 2026-2027
The 3-month trend points up. Values added roughly $1,800 between November 2025 and February 2026, the strongest stretch in the past 12 months.
If the current pace continues, you’d expect Des Moines to finish 2026 a few thousand dollars higher than it started. The signal is small, though, and the longer 12-month gain is still under 1%. That argues against forecasting any sharp move in either direction.
Watch two things over the next two quarters: whether the 50316 / 50314 low-end ZIPs continue to lag the city average, and whether the slow climb stalls again like it did in mid-2025. Both will tell you more about where Des Moines is headed than headline numbers will.
Similar Markets in IA
- Cedar Rapids — another mid-size Iowa metro worth comparing on price and rent.
- Iowa City — a college-driven market with different demand patterns than Des Moines.
- Davenport — a Quad Cities option for buyers who want eastern Iowa pricing.
- Sioux City — a smaller western Iowa market that grew 1.1% over four years.
- Dubuque — a smaller historic river city to compare against the capital.
Frequently Asked Questions
What is the average home price in Des Moines?
The average home price in Des Moines, IA is $224,776 as of February 2026. That figure represents the Zillow Home Value Index for typical mid-tier homes across 11 ZIP codes inside the city limits.
Are home prices going up or down in Des Moines?
Prices are up 0.8% year over year — a near-flat reading. Values rose more in the most recent four months (about $1,800 added since November 2025) than they did across the prior eight months combined.
Is it cheaper to rent or buy in Des Moines?
Renting is cheaper in nearly every ZIP. Typical rent ranges from $919 in 50314 to $1,498 in 50316, while owning a $224,776 home with 10% down at current rates pushes monthly costs near $1,800 once taxes and insurance are included.
What is the most affordable neighborhood in Des Moines?
ZIP 50314 holds the lowest typical home value at $156,823, about 30% below the city median. ZIP 50316 follows closely at $159,826, but rent there runs much higher at $1,498.
Methodology
Home values are based on the Zillow Home Value Index (ZHVI), a smoothed measure of typical home values in the 35th to 65th percentile range. Rent estimates use the Zillow Observed Rent Index (ZORI). Population figures come from the U.S. Census Bureau Population Estimates Program (2020-2024 vintage). All datasets are publicly available. Housing data updated 2026-02-28.