Dubuque Home Prices: $287K, Up 5.4% — 3 ZIPs Analyzed (2026)
$286,589. That’s the typical home value in Dubuque, IA as of February 2026 — and it’s up 5.4% from a year ago. While much of the country saw flat or falling prices, Dubuque kept climbing.
Quick answer: The average home price in Dubuque, IA is $286,589 as of February 2026, up 5.4% year over year according to Zillow.
Current Home Prices in Dubuque
The Dubuque housing market is small, steady, and quietly appreciating. Three ZIP codes make up the city’s residential map. Across them, the typical home value sits at $286,589.
| Metric | Value |
|---|---|
| Median home value | $286,589 |
| Year-over-year change | +5.4% |
| Cheapest ZIP | $202,399 (52001) |
| Most expensive ZIP | $332,296 (52002) |
| Price range | $202K – $332K |
| ZIPs analyzed | 3 |
| Data through | February 2026 |
The 5.4% annual gain is faster than most metros tracked nationally. It’s also faster than wage growth in eastern Iowa, which means affordability is slipping for first-time buyers even though sticker prices stay well below national medians.
The spread between the cheapest and most expensive ZIPs is roughly $130,000 — wide for a city this size. A buyer with a $250K budget has real options in 52001. That same budget gets shut out of 52002 and 52003, where the typical home runs above $325K.
You’re looking at a market where momentum is real but prices are still anchored to Midwestern levels. A $287K median in Dubuque buys a different kind of house than $287K in Des Moines or the Quad Cities — usually older stock, larger lots, and full basements.
Dubuque Home Prices by Neighborhood
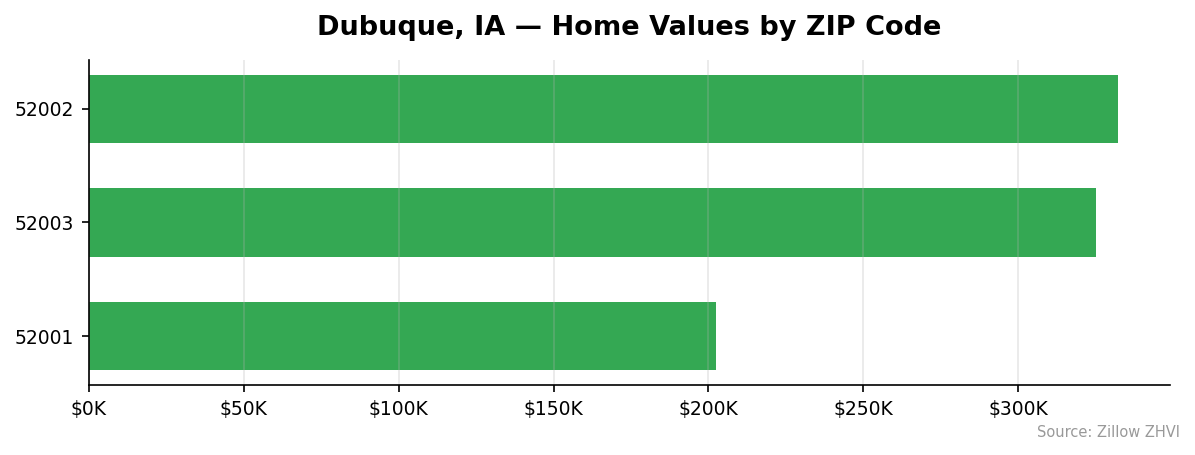
| ZIP | Typical Home Value | vs. City Avg |
|---|---|---|
| 52001 | $202,399 | -29.4% |
| 52002 | $332,296 | +15.9% |
| 52003 | $325,073 | +13.4% |
Most Expensive
52002 — $332,296. The west-side ZIP tops the list, sitting nearly 16% above the city average. Median rent here runs $995, which is actually lower than the urban core — a sign the area skews owner-occupied with newer single-family stock.
52003 — $325,073. Just $7,000 behind 52002, this ZIP forms the second-tier premium market in Dubuque. Values run 13.4% above average.
Most Affordable
52001 — $202,399. The downtown and historic core. At nearly $130,000 below the most expensive ZIP, this is where entry-level buyers and investors look first. Rents here are the highest in the city at $1,087, which suggests stronger rental demand and tighter cap rates than the suburbs.
Rent vs Buy in Dubuque
Median rents in Dubuque sit between $995 and $1,087 depending on the ZIP. ZIP 52001 carries the highest rent at $1,087. ZIP 52002 averages $995. Rent data isn’t yet available for ZIP 52003.
Now do the buying math. A $286,589 home with 20% down ($57,318) leaves a loan balance around $229,000. At a 7% mortgage rate over 30 years, the monthly principal and interest comes to roughly $1,525. Add property taxes (Iowa runs around 1.5% of assessed value), homeowner’s insurance, and basic maintenance, and you’re looking at $2,000 to $2,200 per month all-in.
That’s nearly double the median rent.
For a renter pulling down the median Dubuque household income, the gap between renting and owning is large enough that buying only makes sense if you plan to stay 5+ years and you’re confident appreciation continues. Given the steady upward trend visible in the data, that’s not an unreasonable bet — but it’s not a slam dunk either.
If you’re looking at the cheapest ZIP (52001) where homes run $202,399, the math tightens. A 20% down purchase there carries a monthly cost closer to $1,500, which is much closer to local rents.
Population Growth and Migration
Dubuque is losing residents — slowly. The city’s population stood at 58,987 in 2024, down from 59,653 in 2020. That’s a 1.1% decline over four years.
| Year | Population |
|---|---|
| 2020 | 59,653 |
| 2021 | 59,281 |
| 2022 | 58,928 |
| 2023 | 58,941 |
| 2024 | 58,987 |
The decline bottomed out in 2022 and the city has added small numbers each year since. It’s not growing the way Des Moines suburbs are growing — but it’s no longer hemorrhaging residents either.
Compare that to other Iowa cities:
| City | 2024 Population | 4-Year Growth |
|---|---|---|
| Ankeny | 76,727 | +11.9% |
| West Des Moines | 73,664 | +6.9% |
| Ames | 69,026 | +3.8% |
| Iowa City | 76,710 | +2.4% |
| Sioux City | 86,875 | +1.1% |
| Dubuque | 58,987 | -1.1% |
Dubuque is the only one in the comparison set that lost population. That matters for housing because flat or declining demographics usually mean softer price growth. The fact that Dubuque prices are still climbing 5.4% suggests supply is even tighter than demand is weak — likely a function of low new construction.
Dubuque Housing Market Trends
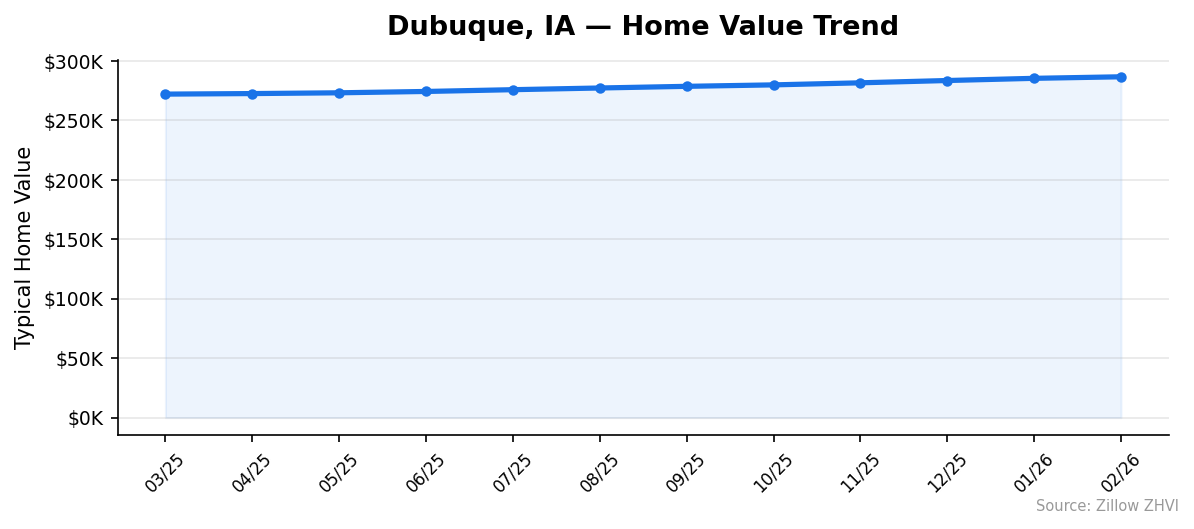
| Month | Median Value |
|---|---|
| Feb 2026 | $286,589 |
| Jan 2026 | $285,293 |
| Dec 2025 | $283,450 |
| Nov 2025 | $281,522 |
| Oct 2025 | $279,788 |
| Sep 2025 | $278,564 |
| Aug 2025 | $277,166 |
| Jul 2025 | $275,744 |
| Jun 2025 | $274,254 |
| May 2025 | $273,124 |
| Apr 2025 | $272,476 |
| Mar 2025 | $272,021 |
Twelve straight months of gains. That’s the pattern. From $272,021 in March 2025 to $286,589 in February 2026, the median rose $14,568 — roughly $1,200 per month on average.
The pace held remarkably steady. No spike, no pause. The smallest monthly gain was about $455 (March to April 2025); the largest was around $1,928 (October to November 2025). The recent three months (December through February) added about $3,100 combined, which annualizes to a slightly faster clip than the trailing 12-month rate.
There’s no sign in the data of a turnaround or slowdown.
Is Dubuque a Good Place to Buy in 2026?
The data says yes, with caveats.
Prices are rising consistently. Inventory is tight enough that 5.4% annual appreciation is happening despite a shrinking population — meaning if you buy and hold for 5+ years, you’re likely to gain equity. The cheapest ZIP (52001) at $202K is genuinely affordable by national standards. A buyer with $40K saved can put 20% down on a starter home there.
The caveat: this is a seller’s market right now. The 12-month trend shows no soft patches buyers can exploit. You won’t be negotiating 5% off list. Multiple-offer situations are likely on well-priced homes in 52002 and 52003.
If you’re a renter calculating the breakeven, the gap is wider than in most cities — buying costs roughly 2x the rent. You need a long time horizon and stable income to justify the switch. If you’re already a homeowner thinking about trading up, the same appreciation that’s growing your equity is also raising the cost of your next house.
Investors should focus on 52001 where rent-to-price ratios are most favorable.
Dubuque Housing Market Outlook for 2026-2027
The 12-month trend points one direction: up. If the current pace continues, Dubuque’s median home value would cross $300,000 sometime in late 2026 or early 2027.
The 3-month trend (December through February) ran about $1,050 per month. That’s slightly above the 12-month average of roughly $1,200. Momentum looks intact heading into spring buying season, which historically adds further upward pressure.
What could change the picture? A jump in mortgage rates, a regional employment shock, or a sudden burst of new construction. None of those are visible in the data provided. The shrinking population is the most plausible counterweight long-term, but it hasn’t slowed prices yet.
For buyers, waiting six months means likely paying $5,000 to $7,000 more for the same house — assuming the trend holds. For sellers, the listing math keeps improving.
Similar Markets in IA
- Cedar Rapids — Iowa’s second-largest city, worth comparing if you want a bigger metro at similar price points.
- Iowa City — University-driven market with stronger population growth than Dubuque.
- Des Moines — The state capital, with deeper inventory and a faster-growing job market.
- Davenport — Quad Cities market just down the Mississippi from Dubuque.
- Waterloo — Another mid-size Iowa city worth a price comparison.
Frequently Asked Questions
What is the average home price in Dubuque?
The average home price in Dubuque, IA is $286,589 as of February 2026. That number is the Zillow Home Value Index across the city’s three residential ZIP codes. Individual neighborhoods range from $202,399 in ZIP 52001 to $332,296 in ZIP 52002.
Are home prices going up or down in Dubuque?
Prices are up 5.4% year over year. The trend has been remarkably consistent — values have risen every single month for the past 12 months, gaining about $14,500 on the median home over that period.
Is it cheaper to rent or buy in Dubuque?
Renting is significantly cheaper on a monthly basis. Median rents run $995 to $1,087, while a typical mortgage on a $287K home with 20% down at current rates runs roughly $2,000 to $2,200 all-in. Buying only pencils out for owners with a 5+ year horizon.
What is the most affordable neighborhood in Dubuque?
ZIP 52001 — the downtown and historic urban core — is the cheapest at $202,399. That’s nearly 30% below the city average and the only Dubuque ZIP under $300K. Rents there are also the highest in the city, suggesting strong rental demand.
Methodology
Home values are based on the Zillow Home Value Index (ZHVI), a smoothed measure of typical home values in the 35th to 65th percentile range. Rent estimates use the Zillow Observed Rent Index (ZORI). Population figures come from the U.S. Census Bureau Population Estimates Program (2020-2024 vintage). All datasets are publicly available. Housing data updated 2026-02-28.