Cedar Rapids Home Prices: $226K, Up 3.5% — 6 ZIPs (2026)
$225,848. That’s the median home value in Cedar Rapids, IA as of February 2026. Prices are up 3.5% from a year ago — a steady climb, not a spike.
Quick answer: The average home price in Cedar Rapids, IA is $225,848 as of February 2026, up 3.5% year over year according to Zillow.
Current Home Prices in Cedar Rapids
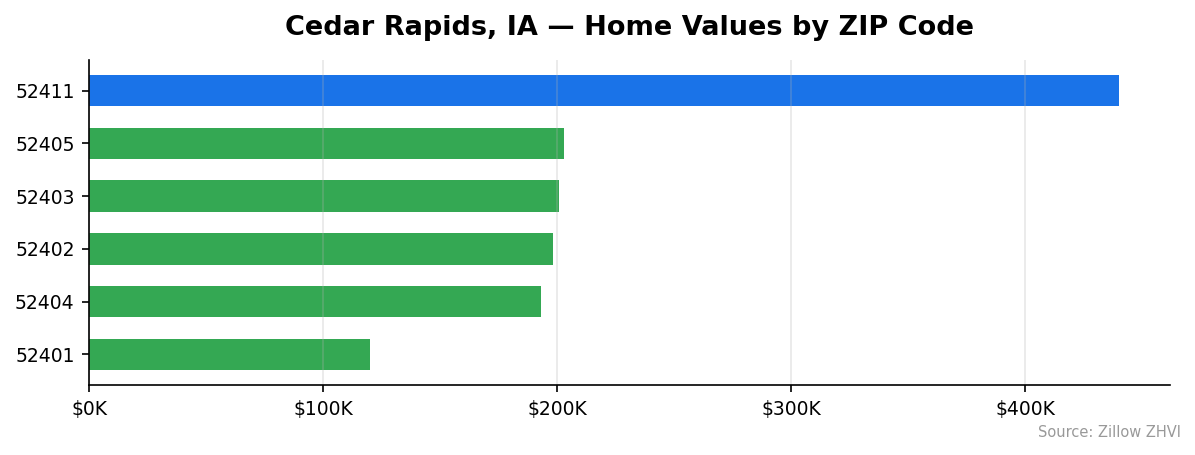
The Cedar Rapids market sits well below the national median. Six ZIP codes report data, ranging from a low of $120,064 to a high of $439,970. That’s a 3.7x spread — wide for a metro of this size.
| Metric | Value |
|---|---|
| Median home value | $225,848 |
| Year-over-year change | +3.5% |
| Cheapest ZIP | $120,064 (52401) |
| Most expensive ZIP | $439,970 (52411) |
| ZIP codes tracked | 6 |
| Data as of | February 2026 |
The 3.5% annual gain outpaces the national rate of inflation but lags hotter Midwest markets like Indianapolis and Columbus. For buyers, that means the city offers entry points under $200K in several neighborhoods — something rare in most metros now.
The price floor matters here. A typical home in ZIP 52401 costs less than half the city average. If you’re a first-time buyer priced out of bigger markets, Cedar Rapids puts ownership within reach of a single income.
The ceiling tells a different story. ZIP 52411, on the northern edge of the city, hit $439,970 — nearly double the city median. That gap reflects newer construction and larger lot sizes, not a sudden surge. The same ZIP led the city a year ago.
Cedar Rapids Home Prices by Neighborhood
Here’s the full ZIP breakdown, cheapest to most expensive:
| ZIP Code | Home Value | Avg Rent | vs City Median |
|---|---|---|---|
| 52401 | $120,064 | $1,231 | -47% |
| 52404 | $193,014 | $1,192 | -15% |
| 52402 | $198,218 | $1,114 | -12% |
| 52403 | $200,986 | $1,260 | -11% |
| 52405 | $202,838 | $1,085 | -10% |
| 52411 | $439,970 | Data not available | +95% |
Most Expensive
- 52411 — $439,970. The northern edge of Cedar Rapids and the only ZIP above the city median. It costs roughly twice what you’d pay in any other ZIP.
- 52405 — $202,838. The west side, with rents averaging $1,085 — the lowest rent in the city despite mid-tier home values.
- 52403 — $200,986. Northeast Cedar Rapids. Rent here runs $1,260, the highest in the city.
Most Affordable
- 52401 — $120,064. Downtown and the urban core. At 47% below the city median, it’s the only ZIP under $150K.
- 52404 — $193,014. South Cedar Rapids. Roughly $33,000 below the city median with rent at $1,192.
- 52402 — $198,218. North-central Cedar Rapids. Home values sit 12% below the city average and rent runs $1,114.
Rent vs Buy in Cedar Rapids
Rent across reporting ZIPs averages $1,176 per month. The cheapest ZIP for rent is 52405 at $1,085. The most expensive is 52403 at $1,260.
Now the buying math. On a $225,848 home with 20% down ($45,170), you’d finance $180,678. At a 7% 30-year fixed rate, that’s roughly $1,202 in principal and interest. Add about $300 for property taxes and $100 for insurance, and the monthly cost lands near $1,600.
| Cost | Monthly |
|---|---|
| Average rent (city) | $1,176 |
| Mortgage on median home (20% down) | ~$1,600 |
| Difference | ~$424 |
Renting wins by about $424 a month — over $5,000 a year. That gap shrinks if you have less than 20% down (you’d add PMI but reduce upfront cash) or if rates fall.
The math flips for cheap ZIPs. A $120,064 home in 52401 with 20% down works out to about $850 a month all-in — well below the $1,231 average rent for that ZIP. If you can find inventory at the low end, buying clearly beats renting.
For mid-tier homes in 52402, 52403, 52404, and 52405, the rent-vs-buy decision is closer. Tax escrow, maintenance, and HOA fees can swing it either way.
Population Growth and Migration
Cedar Rapids is flat. The 2024 population estimate is 137,904 — just 47 people more than 2020. That’s a 0.0% change over four years.
| Year | Population |
|---|---|
| 2020 | 137,857 |
| 2021 | 137,112 |
| 2022 | 136,861 |
| 2023 | 136,637 |
| 2024 | 137,904 |
Population dipped from 2020 to 2023 before rebounding in 2024. The bounce got the city back to 2020 levels but didn’t push above them.
Compare that to other Iowa cities:
| City | 2024 Population | 4-Year Growth |
|---|---|---|
| Ankeny | 76,727 | +11.9% |
| West Des Moines | 73,664 | +6.9% |
| Ames | 69,026 | +3.8% |
| Iowa City | 76,710 | +2.4% |
| Sioux City | 86,875 | +1.1% |
| Cedar Rapids | 137,904 | 0.0% |
The Des Moines suburbs are pulling Iowa’s growth. Ankeny added more than 8,000 residents in four years. Cedar Rapids added 47.
Flat population means flat housing demand from new arrivals. The 3.5% price gain here is being driven by existing residents trading up, low inventory, and cheaper money — not net migration. That’s worth knowing if you’re betting on appreciation.
Cedar Rapids Housing Market Trends
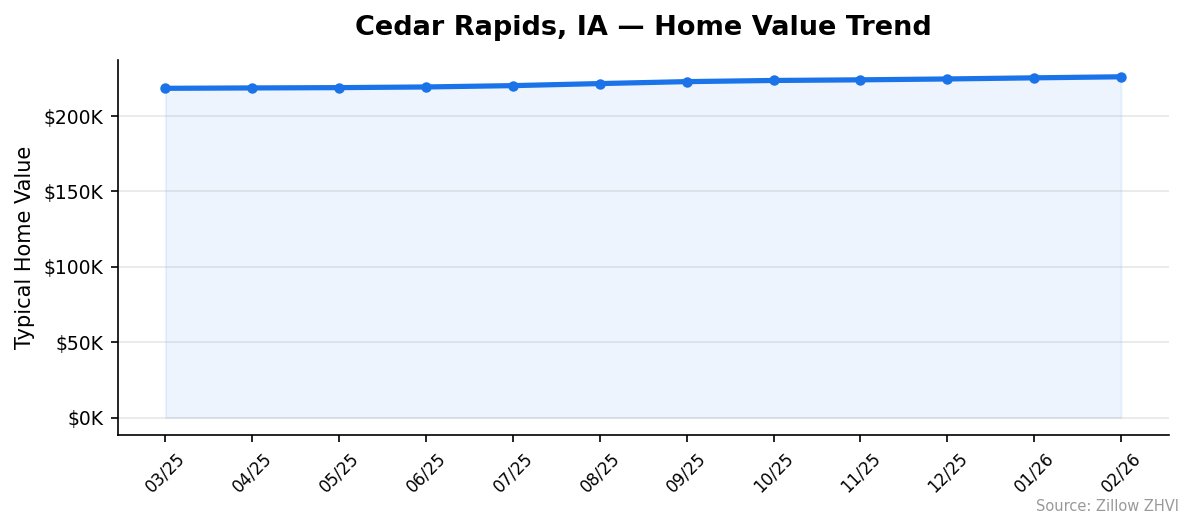
The 12-month price path has been a steady climb. No big jumps, no pullbacks.
| Month | Median Value |
|---|---|
| March 2025 | $218,212 |
| April 2025 | $218,460 |
| May 2025 | $218,663 |
| June 2025 | $219,110 |
| July 2025 | $219,992 |
| August 2025 | $221,346 |
| September 2025 | $222,641 |
| October 2025 | $223,411 |
| November 2025 | $223,832 |
| December 2025 | $224,408 |
| January 2026 | $225,153 |
| February 2026 | $225,848 |
That’s $7,636 added in 12 months — a 3.5% gain. The pace has been remarkably consistent, averaging $636 per month with no down months.
The fastest growth came in late summer 2025, when values added more than $1,000 in a single month between July and August. Winter was slower but still positive. February 2026 came in $695 above January — close to the 12-month average.
You won’t find volatility here. That’s a feature, not a flaw, if you want predictable equity build-up.
Is Cedar Rapids a Good Place to Buy in 2026?
For affordability, yes. The median sits at $225,848 — well below the U.S. median. You can find sub-$200K homes in four of the six ZIPs.
For appreciation, the picture is mixed. Prices are up 3.5%, which beats holding cash but trails Sun Belt markets. Population is flat, which caps how fast values can climb without a demand shock.
The 12-month chart shows zero down months. That’s a seller’s market in the technical sense — supply isn’t keeping up with what little demand exists. But the pace is slow enough that buyers aren’t getting squeezed.
If you want a starter home, an investment property under $150K, or a stable place to park money, Cedar Rapids works. If you want fast equity growth, look elsewhere.
Cedar Rapids Housing Market Outlook for 2026-2027
The 3-month trend suggests prices keep grinding higher. December to February added $1,440 — averaging $480 a month, slightly below the 12-month pace.
If the current pace continues, you’d see the median cross $230,000 by mid-2026 and approach $234,000 by year-end. That’s a rough projection based on the existing momentum, not a forecast.
A few things could break the pattern. Mortgage rates moving below 6% would likely accelerate buying and push prices faster. Rates climbing above 7.5% could stall things. Population still isn’t growing, so there’s a ceiling on how much demand can build.
The most likely path: more of the same. Steady single-digit gains, no crash, no boom.
Similar Markets in IA
- Iowa City — university town, typically pricier than Cedar Rapids.
- Des Moines — the state’s biggest market with stronger population growth.
- Davenport — another eastern Iowa city, similar size and price tier.
- Waterloo — close in geography and often cheaper than Cedar Rapids.
- Dubuque — smaller eastern Iowa market with comparable affordability.
Frequently Asked Questions
What is the average home price in Cedar Rapids?
The average home price in Cedar Rapids, IA is $225,848 as of February 2026. That figure is the Zillow Home Value Index for typical mid-tier homes across six ZIP codes.
Are home prices going up or down in Cedar Rapids?
Prices are up. The median climbed 3.5% year over year, rising from about $218,212 in March 2025 to $225,848 in February 2026. Every single month in that window posted a gain.
Is it cheaper to rent or buy in Cedar Rapids?
Renting is cheaper at the city level. Average rent runs about $1,176 versus an estimated $1,600 monthly cost on a median-priced home with 20% down. The math flips in cheaper ZIPs like 52401, where buying beats renting.
What is the most affordable neighborhood in Cedar Rapids?
ZIP 52401 — downtown and the urban core — is the cheapest at $120,064. That’s 47% below the city median and the only ZIP under $150,000.
Methodology
Home values are based on the Zillow Home Value Index (ZHVI), a smoothed measure of typical home values in the 35th to 65th percentile range. Rent estimates use the Zillow Observed Rent Index (ZORI). Population figures come from the U.S. Census Bureau Population Estimates Program (2020-2024 vintage). All datasets are publicly available. Housing data updated 2026-02-28.