Eagan Home Prices: $380K, Up 1.4% — 3 ZIPs Analyzed (2026)
$380,122. That is what a typical home in Eagan, MN is worth as of February 2026. Values are up 1.4% from a year ago, a modest gain that lags most nearby Twin Cities suburbs.
Quick answer: The average home price in Eagan, MN is $380,122 as of February 2026, up 1.4% year over year according to Zillow.
Current Home Prices in Eagan
Eagan sits in the middle of the Twin Cities suburban price ladder. The typical home is worth roughly $380K, but the spread across the city’s three ZIP codes is wide — about $131,000 separates the cheapest ZIP from the priciest.
| Metric | Value |
|---|---|
| Median home value | $380,122 |
| Year-over-year change | +1.4% |
| Most expensive ZIP | 55123 — $461,611 |
| Most affordable ZIP | 55121 — $330,849 |
| Price spread | $130,762 |
| Metro area | Minneapolis-St. Paul-Bloomington |
| ZIP codes covered | 3 |
The 1.4% annual gain is positive, but it lags general inflation. In real terms, Eagan homes are essentially flat. That matters for sellers expecting another double-digit year and for buyers who have been waiting for a meaningful pullback. Neither group is getting what it wants.
The city’s price floor of $330,849 is notable for the Minneapolis metro. You can still buy a typical home in Eagan for under $340K — that is harder to do in Edina, Plymouth, or Eden Prairie.
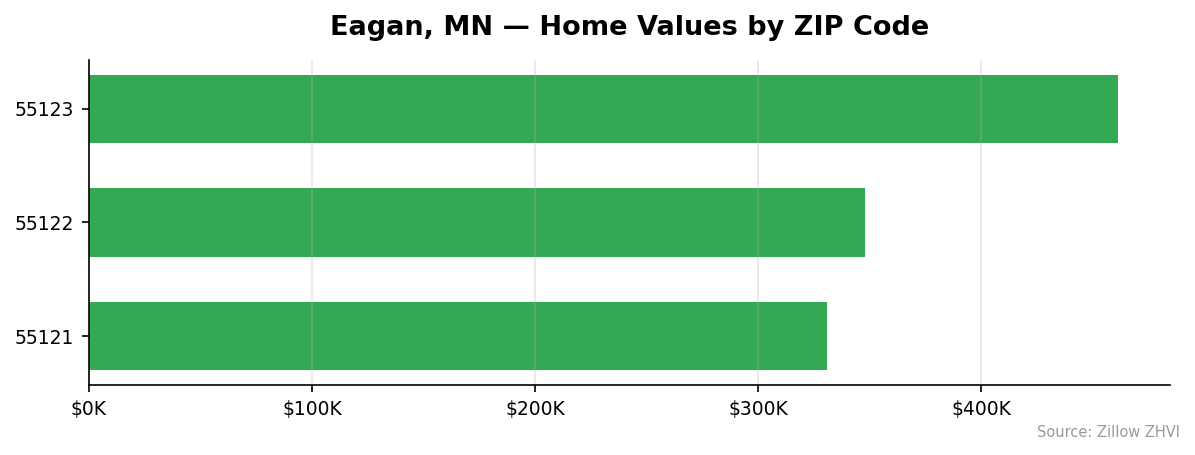
Eagan Home Prices by Neighborhood
Three ZIP codes cover Eagan. The split is roughly: one premium ZIP, one mid-market ZIP, and one entry-level ZIP.
| ZIP Code | Median Home Value | Median Rent |
|---|---|---|
| 55123 | $461,611 | $1,658 |
| 55122 | $347,904 | $1,629 |
| 55121 | $330,849 | $1,383 |
Most Expensive
55123 tops the list at $461,611 — 21% above the city average. Rents in this ZIP also lead, at $1,658 per month, which fits the pattern of higher-value housing stock and larger homes.
Most Affordable
55121 is the cheapest at $330,849, roughly 13% below the city average. It is also the cheapest ZIP for renters at $1,383. 55122 sits in the middle at $347,904, only $17K above 55121 — the real price jump is between 55122 and 55123, not at the bottom of the market.
Rent vs Buy in Eagan
Renting wins on monthly cash flow. Buying wins if you stay long enough to build equity.
Average rent across the three Eagan ZIPs is about $1,557 per month. A mortgage on the $380,122 median home with 20% down ($76,024) at a 7% rate runs roughly $2,024 in principal and interest. Add property taxes (Dakota County runs about 1% of assessed value, or roughly $317 per month) and insurance ($150 per month) and the all-in monthly cost is around $2,491.
That is about $934 more per month than renting. Over a year, you would pay roughly $11,200 more to own.
The math shifts if you plan to stay seven or more years. Equity build and home appreciation start to close the gap, especially at the lower end of the market in 55121 where the entry price is closer to $331K.
If you rent in 55123 at $1,658 and buy in 55121 at $331K with 20% down, the monthly mortgage cost is roughly $2,168 all-in. The owning premium drops to about $510 per month — still real, but tighter.
Population Growth and Migration
Eagan is losing residents. The Census estimates the city had 68,745 people in 2020 and 67,240 in 2024 — a 2.2% decline over four years.
| Year | Population |
|---|---|
| 2020 | 68,745 |
| 2021 | 68,729 |
| 2022 | 67,658 |
| 2023 | 67,574 |
| 2024 | 67,240 |
The drop is steady. Eagan has lost residents every year since 2020. That makes the 1.4% price gain more interesting — values are rising even as the population falls. Limited inventory and strong Twin Cities metro demand are doing the work.
Compare Eagan to other Minnesota cities:
| City | 2024 Population | 4-Year Growth |
|---|---|---|
| Lakeville | 77,971 | +11.3% |
| Woodbury | 80,596 | +6.8% |
| Blaine | 75,172 | +6.7% |
| Rochester | 123,624 | +1.7% |
| Duluth | 87,986 | +1.5% |
| Eagan | 67,240 | -2.2% |
Lakeville, Eagan’s neighbor to the south, is gaining residents five times faster than Rochester. Buyers chasing population growth are choosing Lakeville and Woodbury. Eagan is the value play — fully built out, slightly shrinking, and priced accordingly.
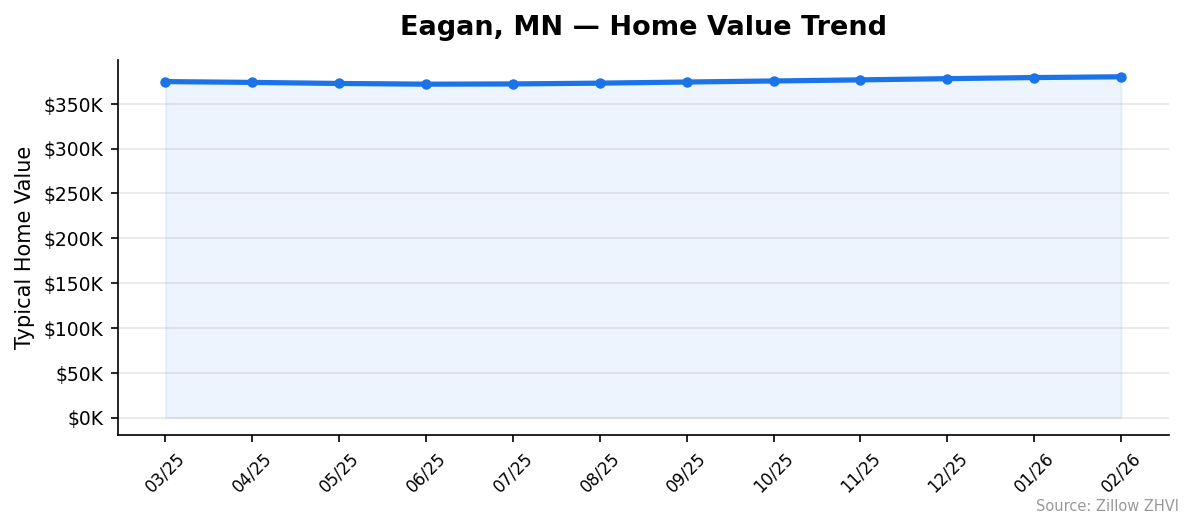
Eagan Housing Market Trends
The 12-month trend shows a soft middle and a firmer end of the year.
| Month | Median Value |
|---|---|
| 2025-03 | $374,760 |
| 2025-04 | $373,860 |
| 2025-05 | $372,670 |
| 2025-06 | $371,891 |
| 2025-07 | $372,151 |
| 2025-08 | $373,026 |
| 2025-09 | $374,289 |
| 2025-10 | $375,458 |
| 2025-11 | $376,691 |
| 2025-12 | $378,039 |
| 2026-01 | $379,262 |
| 2026-02 | $380,122 |
Prices bottomed in June 2025 at $371,891. From there, values climbed every single month — eight consecutive monthly gains through February 2026. The cumulative increase from the June low is about $8,231, or 2.2%.
The recovery has been steady rather than dramatic. Each month added roughly $1,000 to the median. That is a market with quiet momentum, not a boom.
Is Eagan a Good Place to Buy in 2026?
Eagan looks like a balanced market with a slight lean toward sellers right now. Prices have risen eight months in a row. That is the kind of pattern you see when inventory is tight and demand is steady.
For buyers, the math is straightforward. You can still get into Eagan under $340K via ZIP 55121. That is below the metro median and well under what comparable Twin Cities suburbs like Edina or Plymouth ask. The trade-off is a shrinking population — Eagan is not where the metro is adding people.
For sellers, the eight-month price climb is a green light. Listing now means catching the momentum rather than waiting to see if it stalls into summer.
The biggest risk for buyers: rent is significantly cheaper. If you are not staying five-plus years, the math favors renting.
Eagan Housing Market Outlook for 2026-2027
The 3-month trend points up. Values added $2,083 from December 2025 to February 2026 — a pace of about $694 per month, or roughly 2.2% annualized.
If the current pace continues, Eagan’s median could approach $385K by mid-2026. That assumes mortgage rates do not spike and the broader Minneapolis-St. Paul market holds.
There are two forces working against further gains. First, population is shrinking. That caps long-term demand. Second, the year-over-year change is only 1.4% — well below the pace of cities like Lakeville. The 12-month picture is steady, not strong.
Watch the spring 2026 selling season. If monthly gains stall below $500, the upward run is likely topping out. If they accelerate above $1,500, expect another year of meaningful appreciation.
Similar Markets in MN
If you are weighing Eagan against other Minnesota cities, these markets are worth comparing:
- Bloomington — Eagan’s larger neighbor across the Minnesota River, with similar Twin Cities suburb dynamics.
- Eden Prairie — a higher-priced southwest suburb often considered alongside Eagan by relocating buyers.
- Edina — the premium comparison; Edina buyers priced out often consider Eagan as a value alternative.
- Plymouth — a comparable mid-to-upper-tier suburb on the west side of the metro.
- Minneapolis — the urban core; Eagan offers a quieter, lower-density alternative at similar price points.
Frequently Asked Questions
What is the average home price in Eagan?
The typical home in Eagan, MN is worth $380,122 as of February 2026. That number reflects the Zillow Home Value Index for homes in the 35th to 65th percentile range, so it sits closer to a true median than a list-price average.
Are home prices going up or down in Eagan?
Prices are up 1.4% year over year. The gain is positive but trails general inflation, which means real home values are essentially flat. Monthly data shows eight straight months of small increases since June 2025.
Is it cheaper to rent or buy in Eagan?
Renting is cheaper on a monthly basis. Average rent runs about $1,557, while owning the median home with 20% down costs roughly $2,491 all-in — about $934 more per month. Buying makes more sense if you plan to stay at least five to seven years.
What is the most affordable neighborhood in Eagan?
ZIP 55121 is the cheapest at $330,849, about 13% below the city average. It also has the lowest rents in the city at $1,383 per month, making it the entry point for both buyers and renters.
Methodology
Home values are based on the Zillow Home Value Index (ZHVI), a smoothed measure of typical home values in the 35th to 65th percentile range. Rent estimates use the Zillow Observed Rent Index (ZORI). Population figures come from the U.S. Census Bureau Population Estimates Program (2020-2024 vintage). All datasets are publicly available. Housing data updated 2026-02-28.