Minneapolis Home Prices: $333K, Up 0.8% — 18 ZIPs Analyzed (2026)
$333,111. That’s the typical home value in Minneapolis as of February 2026. Prices are up 0.8% from a year ago — barely above flat, but the trend has been climbing for six straight months.
Quick answer: The average home price in Minneapolis, MN is $333,111 as of February 2026, up 0.8% year over year according to Zillow.
Current Home Prices in Minneapolis
The median sits at $333,111 across 18 ZIP codes. That’s modest growth in dollar terms — about $2,500 added since the same time last year. The city’s price spread is wide.
| Metric | Value |
|---|---|
| Median home value | $333,111 |
| Year-over-year change | +0.8% |
| Most expensive ZIP | $579,703 (55410) |
| Most affordable ZIP | $158,627 (55454) |
| Price spread (max − min) | $421,076 |
| ZIP codes tracked | 18 |
| Data month | February 2026 |
| Metro | Minneapolis–St. Paul–Bloomington |
The gap between the cheapest and priciest ZIP is $421,076 — meaning the top end costs 3.7x what the bottom end does. Few major Midwest markets show a spread that wide inside a single city’s borders.
Compared to the metro area, Minneapolis itself runs cheaper than several inner-ring suburbs. The $333K median sits below Edina, Eden Prairie, and Plymouth — all of which clear $400K. It also sits well below the U.S. typical home value, which crossed $360K nationally last year.
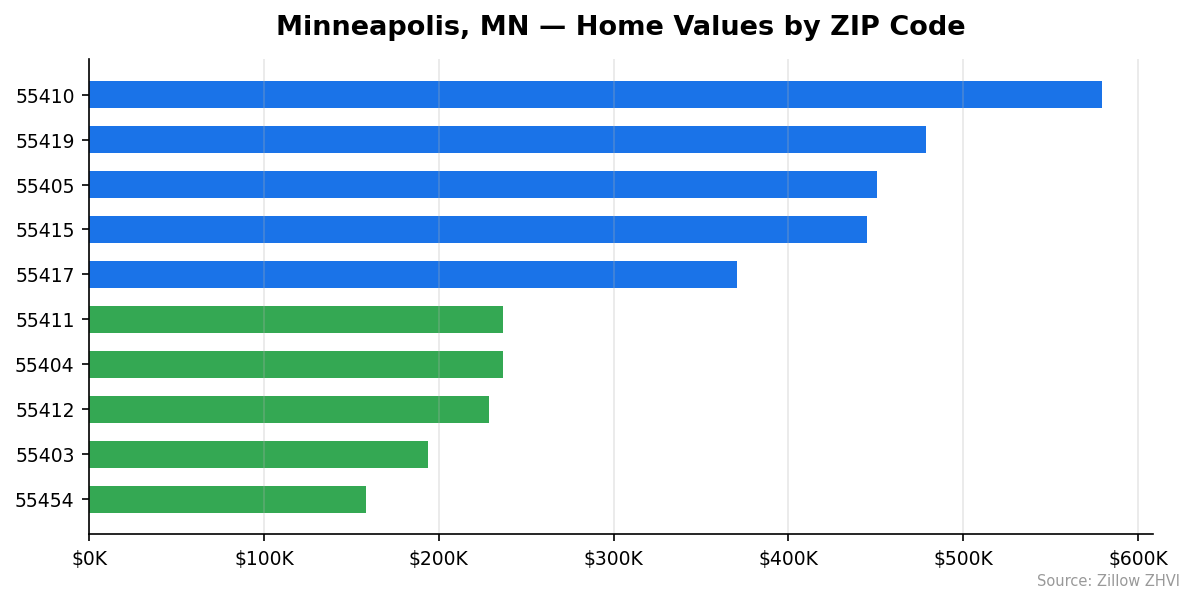
Minneapolis Home Prices by Neighborhood
Eighteen ZIPs cover the city. Southwest neighborhoods (Linden Hills, Fulton, Kenwood) carry the highest prices. North and central ZIPs run cheaper.
| ZIP | Home Value | Avg Rent |
|---|---|---|
| 55410 | $579,703 | $2,657 |
| 55419 | $478,643 | $1,630 |
| 55405 | $450,737 | $1,430 |
| 55415 | $445,144 | $2,092 |
| 55417 | $370,856 | $1,756 |
| 55409 | $360,838 | $1,523 |
| 55414 | $354,996 | $1,794 |
| 55418 | $340,364 | $1,769 |
| 55406 | $334,868 | $1,458 |
| 55413 | $327,580 | $1,718 |
| 55407 | $308,600 | $1,553 |
| 55401 | $307,345 | $1,828 |
| 55408 | $282,167 | $1,445 |
| 55411 | $236,750 | $1,902 |
| 55404 | $236,492 | $1,331 |
| 55412 | $228,616 | $1,976 |
| 55403 | $193,664 | $1,432 |
| 55454 | $158,627 | $1,526 |
Most Expensive
- 55410 — $579,703. Linden Hills and Fulton territory. The priciest ZIP in the city, 74% above the citywide median, with rents to match at $2,657.
- 55419 — $478,643. South Minneapolis around Tangletown and Diamond Lake. Rents ($1,630) are surprisingly close to the city average despite the high home values.
- 55405 — $450,737. Bryn Mawr and Kenwood. Home values run 35% above the median while rents stay near $1,430 — among the widest rent-to-price gaps in the city.
Most Affordable
- 55454 — $158,627. Cedar-Riverside. Less than half the citywide median, with rent of $1,526 — meaning rent runs unusually high relative to home price here.
- 55403 — $193,664. Loring Park. Sub-$200K home values pair with $1,432 rents, an attractive entry point if you can find inventory.
- 55412 — $228,616. North Minneapolis. Rent ($1,976) is higher than in many pricier ZIPs — a clear sign that buying could undercut renting if you have the down payment.
Rent vs Buy in Minneapolis
Average rent across the 18 tracked ZIPs is roughly $1,711 a month. A mortgage on the $333,111 median, assuming 20% down at a 7% rate, comes to about $1,775 in principal and interest — before property taxes and insurance, which add several hundred more.
That math tilts toward renting today, especially in pricier southwest ZIPs.
| ZIP | Home Value | Rent | Implied Buy Cost (P&I, 20% down @ 7%) |
|---|---|---|---|
| 55410 | $579,703 | $2,657 | ~$3,084 |
| 55419 | $478,643 | $1,630 | ~$2,547 |
| 55454 | $158,627 | $1,526 | ~$844 |
| 55412 | $228,616 | $1,976 | ~$1,217 |
| 55403 | $193,664 | $1,432 | ~$1,031 |
Two patterns stand out.
In the priciest ZIPs — 55410, 55405, 55419 — renting beats buying by $400 to $1,000 a month before factoring taxes. The rent-to-price ratio is low, meaning you’d pay heavily for the privilege of owning.
In cheaper north Minneapolis ZIPs — 55412, 55411, 55403 — buying flips the math. Rent in 55412 ($1,976) runs higher than the implied mortgage on a $228K home. Same story in 55411, where rent of $1,902 outpaces what a buyer with cash for a down payment would spend monthly.
The takeaway: where you stand on rent-vs-buy depends entirely on which ZIP you’re shopping. There’s no single answer for Minneapolis as a whole.
Population Growth and Migration
Minneapolis has 428,579 residents as of 2024, down from 430,738 in 2020. That’s a 0.5% loss over four years.
| Year | Population |
|---|---|
| 2020 | 430,738 |
| 2021 | 427,853 |
| 2022 | 422,613 |
| 2023 | 426,569 |
| 2024 | 428,579 |
The city bottomed out in 2022 and has been rebuilding since, adding roughly 6,000 residents over the past two years. But it’s still below 2020 levels.
Suburbs tell a different story.
| City | 2024 Population | 4-Year Growth |
|---|---|---|
| Lakeville | 77,971 | +11.3% |
| Woodbury | 80,596 | +6.8% |
| Blaine | 75,172 | +6.7% |
| Maple Grove | 72,739 | +3.5% |
| Rochester | 123,624 | +1.7% |
| Minneapolis | 428,579 | −0.5% |
Lakeville added 11.3% to its population while Minneapolis shed residents. The migration pattern is clear — households are moving outward to the southern and northern suburbs. For housing demand inside city limits, that’s a headwind. Flat-to-shrinking population helps explain why home price growth has been muted at 0.8% rather than the mid-single digits other Midwest markets posted.
Minneapolis Housing Market Trends
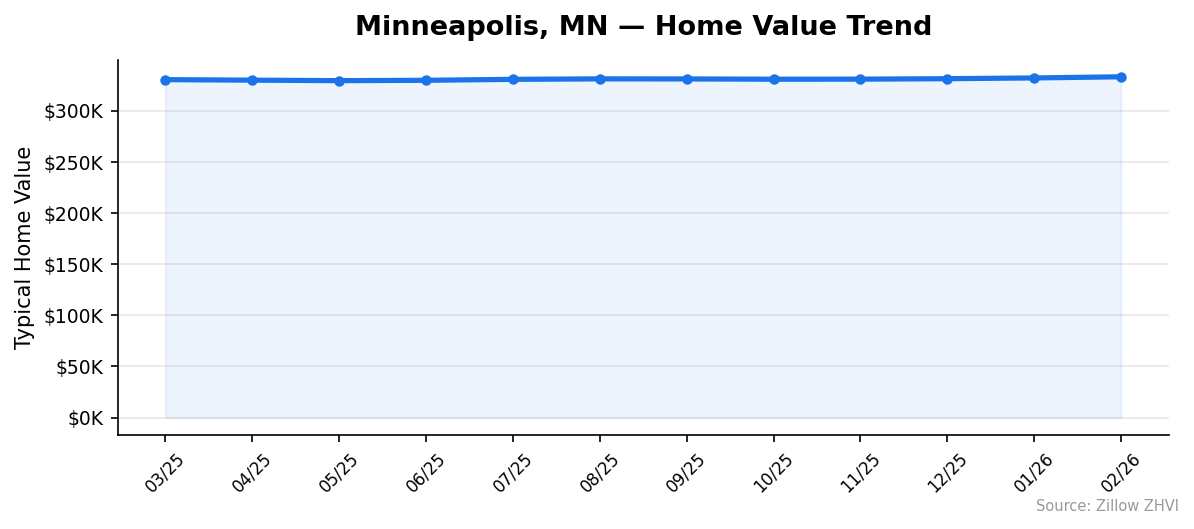
Twelve months of data show steady, slow gains.
| Month | Median |
|---|---|
| Feb 2026 | $333,111 |
| Jan 2026 | $331,992 |
| Dec 2025 | $331,243 |
| Nov 2025 | $330,809 |
| Oct 2025 | $330,745 |
| Sep 2025 | $331,020 |
| Aug 2025 | $331,081 |
| Jul 2025 | $330,618 |
| Jun 2025 | $329,683 |
| May 2025 | $329,337 |
| Apr 2025 | $329,819 |
| Mar 2025 | $330,316 |
Prices dipped through spring and summer 2025, hitting a low of $329,337 in May. Since then values have ticked up six months in a row. The gain over the last six months: roughly $3,800, or 1.1%.
Nothing about this trend is dramatic. Minneapolis is moving sideways with a slight upward bias — a different picture than Sun Belt markets that swung 5% or more during the same window.
Is Minneapolis a Good Place to Buy in 2026?
The data points to a balanced market, leaning slightly toward buyers in some ZIPs.
Year-over-year price growth of 0.8% is below inflation. That means real prices — adjusted for inflation — are falling. Sellers don’t have the upper hand. Population is flat to declining inside city limits, removing the demand pressure you see in faster-growing metros.
For buyers, the affordable ZIPs (55454, 55403, 55412, 55404) are where the math works best. Home values under $240K combined with rents above $1,300 mean monthly costs after a 20% down payment can come in below what you’d pay to rent.
For pricier ZIPs, the case is weaker. At $450K-plus values, mortgage costs blow past local rents by a wide margin. Unless you plan to stay 7+ years and bet on appreciation, renting is the financially safer move.
Minneapolis Housing Market Outlook for 2026-2027
The 6-month trend points up but slowly — about $3,800 added since August 2025. If that pace continues, the median would reach roughly $337K by August 2026 and $341K by early 2027.
That’s a 1-2% annualized rate. Below average national growth, but above the 0.8% YoY currently posted.
Watch the population data. If Minneapolis keeps clawing back residents — it added ~6,000 from 2022 to 2024 — that supports modest price appreciation. If outmigration to suburbs accelerates again, the trend could flatten.
The 3-month momentum is positive but not strong enough to suggest a breakout. Expect more of the same: slow, single-digit gains tracking inflation rather than outpacing it.
Similar Markets in MN
- Saint Paul — the Twin Cities other half, often pricier in select neighborhoods.
- Rochester — buyers willing to leave the metro will find a faster-growing population there.
- Bloomington — a southern suburb that often runs higher than Minneapolis on home values.
- Edina — the premium suburb option, well above Minneapolis prices.
- Brooklyn Park — a northwestern suburb worth comparing if you want similar pricing in a growing area.
Frequently Asked Questions
What is the average home price in Minneapolis?
The average home value in Minneapolis is $333,111 as of February 2026. That figure tracks the typical mid-tier home — homes in the 35th to 65th percentile — across 18 ZIP codes inside city limits.
Are home prices going up or down in Minneapolis?
Prices are up 0.8% year over year. The gain is modest, about $2,500 added to the median, and the past six months have shown small monthly increases after a soft spring 2025.
Is it cheaper to rent or buy in Minneapolis?
It depends on the ZIP. In affordable ZIPs like 55412 and 55411, buying can run cheaper than renting once you have a down payment. In pricier ZIPs like 55410 and 55405, rent comes in well below the mortgage cost on the median home.
What is the most affordable neighborhood in Minneapolis?
ZIP 55454 (Cedar-Riverside) is the cheapest at $158,627 — less than half the citywide median. ZIP 55403 (Loring Park) follows at $193,664, and ZIP 55412 in north Minneapolis comes in at $228,616.
Methodology
Home values are based on the Zillow Home Value Index (ZHVI), a smoothed measure of typical home values in the 35th to 65th percentile range. Rent estimates use the Zillow Observed Rent Index (ZORI). Population figures come from the U.S. Census Bureau Population Estimates Program (2020-2024 vintage). All datasets are publicly available. Housing data updated 2026-02-28.