Brooklyn Park Home Prices: $354K, Up 1.1% — 3 ZIPs Analyzed (2026)
$353,944. That’s the typical home value in Brooklyn Park as of February 2026, up 1.1% from a year ago. The numbers tell a quieter story than most Twin Cities suburbs — slow price growth, only three ZIPs in the city, and a population that’s actually shrinking.
Quick answer: The average home price in Brooklyn Park, MN is $353,944 as of February 2026, up 1.1% year over year according to Zillow.
Current Home Prices in Brooklyn Park
Brooklyn Park sits in the Minneapolis-St. Paul-Bloomington metro and tracks below the headline numbers you see for Edina or Eden Prairie. The current median lands at $353,944, with a spread of roughly $46,000 between the cheapest and priciest ZIPs.
| Metric | Value |
|---|---|
| Median home value | $353,944 |
| Year-over-year change | +1.1% |
| Lowest ZIP value | $331,295 |
| Highest ZIP value | $377,261 |
| ZIP codes covered | 3 |
| Metro area | Minneapolis-St. Paul-Bloomington, MN-WI |
| Data month | February 2026 |
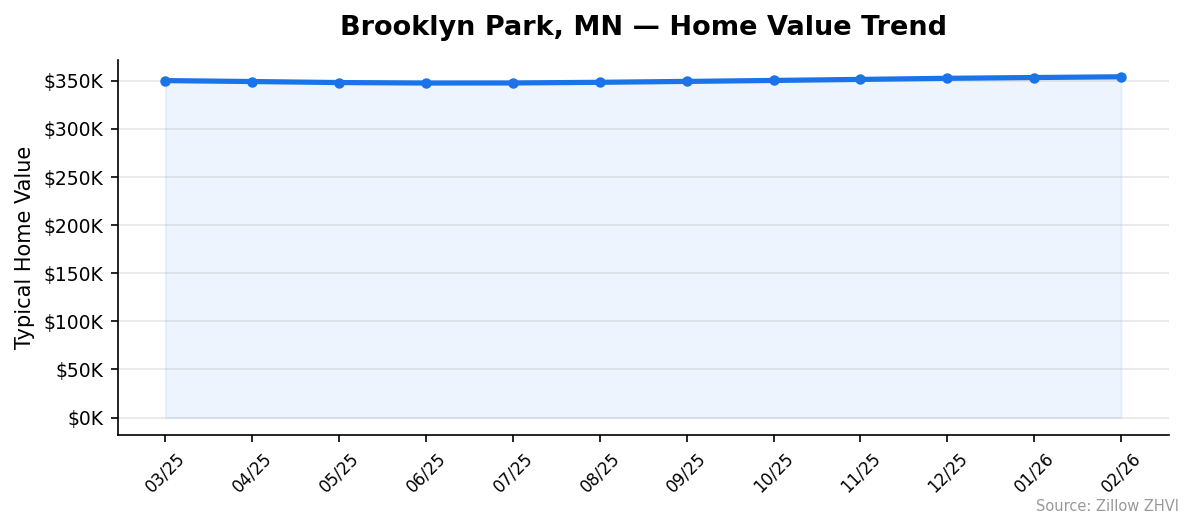
That 1.1% annual gain is modest. For context, the 12-month low came in June 2025 at $347,462 — meaning most of this year’s appreciation happened in the back half of 2025 and early 2026. The market hasn’t been on a tear; it’s been crawling.
The price floor of $331,295 means even the most affordable Brooklyn Park ZIP is still meaningfully above the U.S. median home price. You’re not finding sub-$300K options here. But the ceiling at $377,261 also caps how expensive things get — there’s no luxury tier within city limits the way you’d find in Edina or Wayzata.
Brooklyn Park Home Prices by Neighborhood
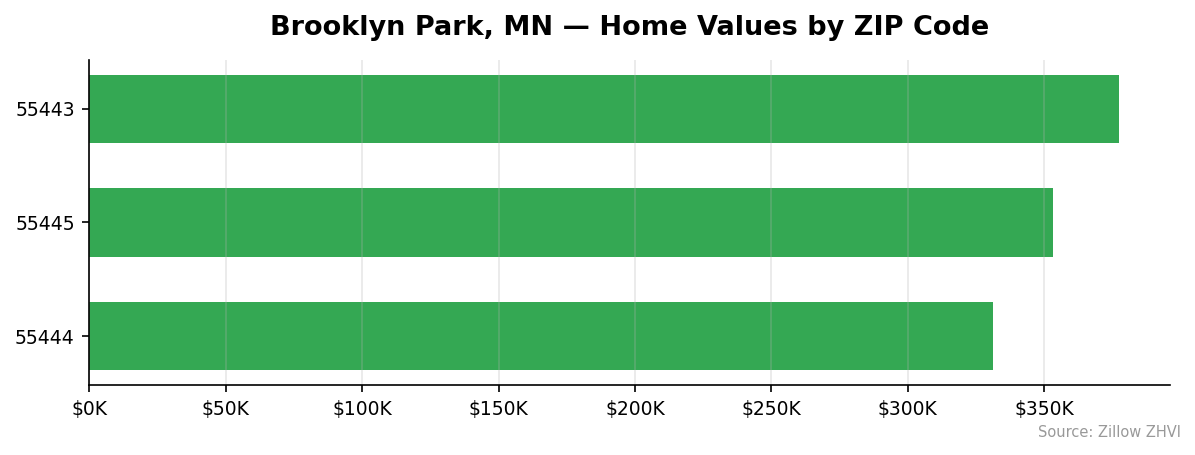
Three ZIP codes carry the entire Brooklyn Park market. Spread between them is real but contained.
| ZIP Code | Median Home Value | Median Rent | vs City Median |
|---|---|---|---|
| 55443 | $377,261 | $1,511 | +6.6% |
| 55445 | $353,275 | $2,241 | -0.2% |
| 55444 | $331,295 | Data not available | -6.4% |
Most Expensive
55443 — $377,261. Sits 6.6% above the city median, the only ZIP in Brooklyn Park clearing the $375K mark. Rent runs $1,511, suggesting it’s a more owner-occupied area where the rental market doesn’t price aggressively.
55445 — $353,275. Almost exactly at the city median. The rent here jumps to $2,241 — higher than 55443 despite lower home prices, which usually points to newer rental inventory or larger units in the rental mix.
Most Affordable
55444 — $331,295. The cheapest entry point in Brooklyn Park, $22,649 below the city median. No rent data is available for this ZIP, so renters comparing options need to look at neighboring areas to gauge the market.
Rent vs Buy in Brooklyn Park
Rent data exists for two of three Brooklyn Park ZIPs. The numbers are split: $1,511 in 55443 and $2,241 in 55445.
| ZIP | Median Rent | Annual Rent Cost |
|---|---|---|
| 55443 | $1,511 | $18,132 |
| 55445 | $2,241 | $26,892 |
Doing the buy-side math on the $353,944 median: a 20% down payment is $70,789, leaving a $283,155 loan. At a 7% 30-year fixed rate, principal and interest alone runs about $1,884/month — before property tax, insurance, and any HOA. Add Minnesota property taxes (typically 1-1.3% of value annually) and you’re looking at roughly $300-385/month in taxes on top, plus insurance.
That puts the all-in monthly cost of buying somewhere in the $2,300-2,500 range for a median home, depending on your tax bill.
Compared to renting:
- In 55443 ($1,511 rent), buying costs roughly $800-1,000 more per month than renting. Renting wins on monthly cash flow.
- In 55445 ($2,241 rent), the gap narrows. Buying costs roughly $100-300 more per month, putting equity buildup in play as a tiebreaker.
The rent-vs-buy answer in Brooklyn Park depends heavily on which ZIP you’re comparing. The city’s modest 1.1% appreciation rate also matters — slow price growth means owners aren’t building equity quickly enough to offset the carrying-cost gap in the cheaper rental ZIP.
Population Growth and Migration
Brooklyn Park is losing people. That’s not a marketing line — it’s what the Census numbers show.
| Year | Population |
|---|---|
| 2020 | 86,216 |
| 2021 | 84,505 |
| 2022 | 83,481 |
| 2023 | 82,333 |
| 2024 | 82,893 |
The four-year change is -3.9%. The city peaked at 86,216 in 2020, lost residents every year through 2023, then ticked back up slightly in 2024. A 560-person rebound doesn’t undo a 3,883-person decline.
Compare that to other Minnesota cities:
| City | 2024 Population | 4-Year Growth |
|---|---|---|
| Lakeville | 77,971 | +11.3% |
| Woodbury | 80,596 | +6.8% |
| Blaine | 75,172 | +6.7% |
| Maple Grove | 72,739 | +3.5% |
| Rochester | 123,624 | +1.7% |
| Brooklyn Park | 82,893 | -3.9% |
Every nearby comparable is growing. Brooklyn Park is the outlier. That has direct housing implications: shrinking demand keeps a lid on price appreciation, which is exactly what the 1.1% YoY figure reflects. Suburbs adding 11% to their population don’t post 1% home-value growth — they post 4-6%.
For buyers, slower growth means less competition. For sellers, it means the days of bidding wars are unlikely to return absent a population reversal.
Brooklyn Park Housing Market Trends
The 12-month price path shows a U-shape — drift down through summer 2025, then steady gains.
| Month | Median Value |
|---|---|
| March 2025 | $349,998 |
| April 2025 | $349,015 |
| May 2025 | $347,966 |
| June 2025 | $347,462 |
| July 2025 | $347,533 |
| August 2025 | $348,220 |
| September 2025 | $349,148 |
| October 2025 | $350,148 |
| November 2025 | $351,228 |
| December 2025 | $352,362 |
| January 2026 | $353,184 |
| February 2026 | $353,944 |
June 2025 was the bottom at $347,462. From there, prices climbed in eight straight months. The total gain from June low to February peak is $6,482, or about 1.9% over eight months — roughly 2.8% annualized if the pace held.
The deceleration is worth watching. Monthly gains were stronger in the fall ($1,000+ jumps) and have shrunk to $760-822 in December through February. Momentum is fading even as the trend stays positive.
Is Brooklyn Park a Good Place to Buy in 2026?
The data points to a balanced market tilting slightly toward buyers. Three signals support that read:
- Price growth is slow at 1.1% YoY. That’s well below inflation, meaning real prices are flat to slightly down.
- Population is shrinking. A 3.9% four-year decline removes the demand pressure that drives competitive markets.
- Monthly momentum is weakening. Fall 2025 gains of $1,000+ per month have shrunk to under $800.
For buyers, this means more negotiating room. You’re unlikely to face the bidding-war environment of 2021-2022, and slow appreciation keeps your downside risk lower if you need to sell within a few years.
For sellers, the environment is harder. Slow growth and population loss mean homes priced ambitiously will sit. Pricing close to the local ZIP median and accepting modest gains is the realistic path.
The cheapest ZIP (55444) under $335K offers the best entry-cost math for first-time buyers. The middle ZIP (55445) makes the strongest rent-vs-buy case given its $2,241 rent benchmark.
Brooklyn Park Housing Market Outlook for 2026-2027
The 3-month trend suggests continued slow appreciation. Monthly gains have averaged $787 from December through February, down from $1,067 in October-November. If the current pace continues, Brooklyn Park could see another 2-3% in price gains over the next 12 months — roughly in line with the trailing year.
Two factors could shift that. A return to population growth would tighten supply and push gains higher. Continued shrinkage matching the 2020-2023 pattern would likely flatten or reverse appreciation, especially if rates stay elevated.
The narrowing monthly gains in early 2026 hint at a market reaching a ceiling at this rate environment. Watch for whether March-May 2026 readings hold above the $787 monthly average or slip below $500. The latter would signal momentum has run out.
Similar Markets in MN
If Brooklyn Park’s prices or population trend doesn’t fit your search, these Minnesota markets offer different profiles:
- Minneapolis — the urban core, with a wider range of ZIP-level price points than Brooklyn Park’s three.
- Saint Paul — a comparable metro alternative with broader neighborhood variety.
- Plymouth — a nearby suburb worth comparing for buyers weighing the western Twin Cities.
- Maple Grove — adjacent to Brooklyn Park and one of the few nearby suburbs still adding population.
- Rochester — a larger Minnesota market outside the Twin Cities entirely, for buyers willing to relocate.
Frequently Asked Questions
What is the average home price in Brooklyn Park?
The average home price in Brooklyn Park, MN is $353,944 as of February 2026. That’s the median across the city’s three ZIP codes — 55443, 55444, and 55445 — using the Zillow Home Value Index.
Are home prices going up or down in Brooklyn Park?
Prices are up 1.1% year over year. After bottoming at $347,462 in June 2025, the median rose for eight straight months, though monthly gains have slowed from over $1,000 in fall 2025 to about $760 in February 2026.
Is it cheaper to rent or buy in Brooklyn Park?
It depends on the ZIP. In 55443, rent runs $1,511 — well below the roughly $2,300-2,500 monthly carrying cost of buying the median home. In 55445, rent is $2,241, much closer to ownership costs and making the buy-vs-rent math nearly even.
What is the most affordable neighborhood in Brooklyn Park?
ZIP 55444 is the cheapest at $331,295, sitting $22,649 below the city median. It’s the only Brooklyn Park ZIP under $350,000 and the lowest entry point for buyers in the city.
Methodology
Home values are based on the Zillow Home Value Index (ZHVI), a smoothed measure of typical home values in the 35th to 65th percentile range. Rent estimates use the Zillow Observed Rent Index (ZORI). Population figures come from the U.S. Census Bureau Population Estimates Program (2020-2024 vintage). All datasets are publicly available. Housing data updated 2026-02-28.