Rochester Home Prices: $363K, Up 3.5% — 4 ZIPs Analyzed (2026)
$363K. That’s what a typical home costs in Rochester, MN right now — and the number keeps climbing. Prices are up 3.5% from a year ago, with every month in the past 12 posting gains. If you’re house hunting in Mayo Clinic’s hometown, here’s what the data actually says.
Quick answer: The average home price in Rochester, MN is $362,722 as of February 2026, up 3.5% year over year according to Zillow.
Current Home Prices in Rochester
Rochester’s housing market has been on a slow, steady climb. The median home value hit $362,722 in February 2026, continuing a streak of monthly increases that stretches back to at least spring 2025.
| Metric | Value |
|---|---|
| Median Home Value | $362,722 |
| Year-over-Year Change | +3.5% |
| Lowest ZIP Median | $283,567 |
| Highest ZIP Median | $460,950 |
| ZIP Codes Tracked | 4 |
| Data As Of | February 2026 |
That 3.5% annual gain translates to roughly $12,250 in added value over the past year. The gap between the cheapest and most expensive ZIP codes is $177,383 — meaning where you buy within the city matters a lot.
Rochester sits well below the national median, which makes it accessible compared to metros on either coast. But prices here haven’t dipped once in the past 12 months. Each month brought a small increase, usually between $1,000 and $2,000. That kind of consistency signals a market with stable demand and limited inventory pressure.
For buyers waiting for a correction, the data doesn’t support one in the near term.
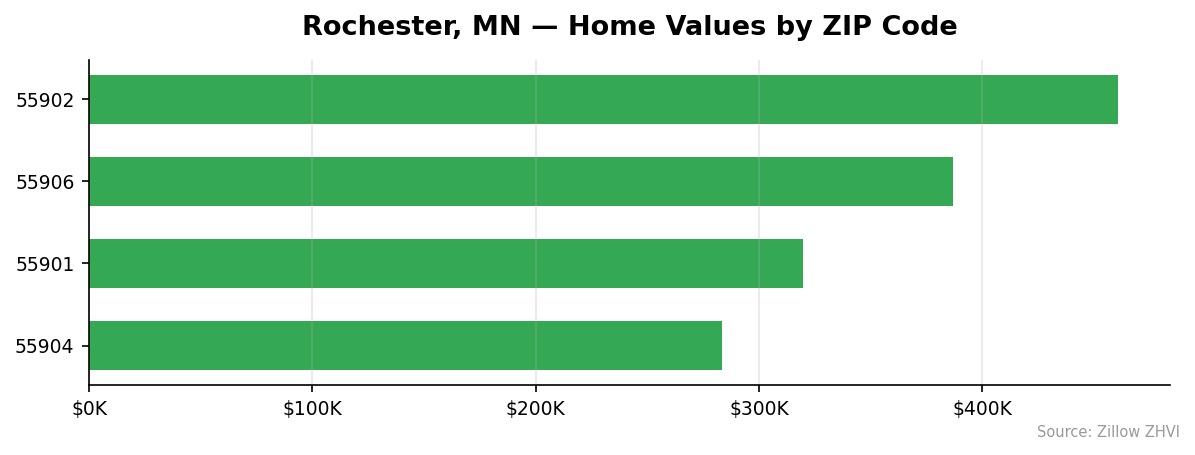
Rochester Home Prices by Neighborhood
Rochester has four tracked ZIP codes, and the price spread across them is significant. The most expensive ZIP costs 63% more than the least expensive.
| ZIP Code | Median Home Value | Avg. Rent | vs. City Median |
|---|---|---|---|
| 55902 | $460,950 | $1,678/mo | +27.1% |
| 55906 | $386,675 | $1,290/mo | +6.6% |
| 55901 | $319,694 | $1,587/mo | -11.9% |
| 55904 | $283,567 | $1,655/mo | -21.8% |
Most Expensive
55902 leads at $460,950, nearly $100K above the city average — this is Rochester’s premium market, and it carries the highest rents to match at $1,678 per month.
Most Affordable
55904 is the entry point at $283,567, roughly 22% below the city median. Interestingly, rents here ($1,655) are higher than in 55906, which means the price-to-rent ratio in 55904 may actually favor buying over renting.
55901 comes in at $319,694 with $1,587 monthly rent — a middle-ground option that still saves you $43K compared to the city median.
One oddity in the data: 55906 has the second-highest home values but the lowest rent at $1,290. That disconnect could reflect a neighborhood with more owner-occupants and fewer rental properties on the market.
Rent vs Buy in Rochester
Renting is cheaper on a monthly basis, but the math isn’t straightforward across every ZIP.
| ZIP Code | Median Home Value | Monthly Rent | Est. Mortgage | Monthly Difference |
|---|---|---|---|---|
| 55901 | $319,694 | $1,587 | ~$2,040 | Rent saves ~$453 |
| 55902 | $460,950 | $1,678 | ~$2,940 | Rent saves ~$1,262 |
| 55904 | $283,567 | $1,655 | ~$1,810 | Rent saves ~$155 |
| 55906 | $386,675 | $1,290 | ~$2,470 | Rent saves ~$1,180 |
Mortgage estimate assumes 20% down, 6.8% rate, 30-year fixed. Does not include taxes, insurance, or HOA.
Renting wins on pure monthly cash flow in every ZIP code. But the gap varies wildly. In 55904, you’re only paying $155 more per month to own — and you’re building equity. In 55902, the gap balloons to over $1,200.
The standout is 55906. Despite having the second-highest home prices, rent there is just $1,290 — the lowest in the city. If you’re renting in 55906, you’re getting a bargain. If you’re buying, you’re paying a premium relative to what renters pay.
For buyers who can stretch into 55904, the rent-to-own math is the closest to break-even.
Population Growth and Migration
Rochester’s population reached 123,624 in 2024, up 1.7% from 121,575 in 2020. Growth has been modest but consistent, adding about 500 residents per year.
| Year | Population | Change |
|---|---|---|
| 2020 | 121,575 | — |
| 2021 | 121,845 | +270 |
| 2022 | 121,979 | +134 |
| 2023 | 122,658 | +679 |
| 2024 | 123,624 | +966 |
Growth accelerated in 2023 and 2024. The city added nearly 1,000 people in 2024 alone — more than the previous two years combined.
How does Rochester compare to other Minnesota cities?
| City | 2024 Population | 4-Year Growth |
|---|---|---|
| Lakeville | 77,971 | +11.3% |
| Woodbury | 80,596 | +6.8% |
| Blaine | 75,172 | +6.7% |
| Maple Grove | 72,739 | +3.5% |
| Rochester | 123,624 | +1.7% |
| Duluth | 87,986 | +1.5% |
Rochester is the largest city on this list but one of the slowest-growing in percentage terms. The Twin Cities suburbs — Lakeville, Woodbury, Blaine — are expanding far faster. That said, Rochester’s growth is accelerating, not slowing. More people means more housing demand, which helps explain the persistent price increases.
Rochester Housing Market Trends
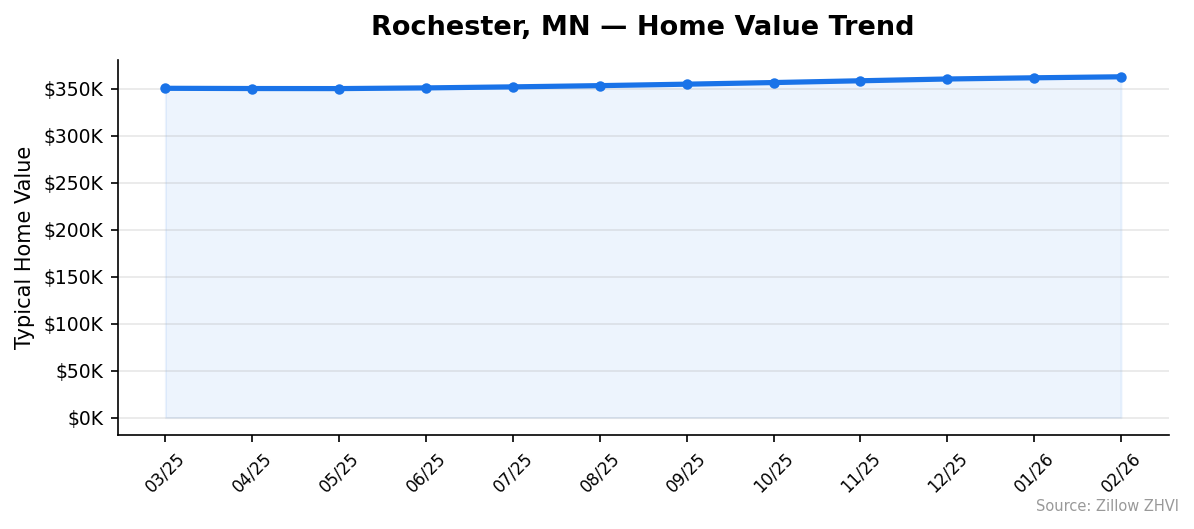
Here’s how Rochester’s median home value moved month by month over the past year.
| Month | Median Value | Monthly Change |
|---|---|---|
| Mar 2025 | $350,473 | — |
| Apr 2025 | $350,222 | -$251 |
| May 2025 | $350,159 | -$63 |
| Jun 2025 | $350,891 | +$732 |
| Jul 2025 | $352,002 | +$1,111 |
| Aug 2025 | $353,301 | +$1,299 |
| Sep 2025 | $354,864 | +$1,563 |
| Oct 2025 | $356,585 | +$1,721 |
| Nov 2025 | $358,480 | +$1,895 |
| Dec 2025 | $360,375 | +$1,895 |
| Jan 2026 | $361,654 | +$1,279 |
| Feb 2026 | $362,722 | +$1,068 |
The trend tells a clear story. Prices dipped very slightly in April and May 2025 — a total decline of $314 — then reversed course and climbed every month since. The biggest monthly gains came in October and November 2025, each adding close to $1,900.
The pace has slowed a bit into early 2026. February’s gain of $1,068 is about half the fall peak. That’s normal seasonal deceleration, not a sign of weakness.
Over the full 12 months, Rochester added $12,249 to its median value. That’s the equivalent of roughly $1,020 per month in appreciation.
Is Rochester a Good Place to Buy in 2026?
The numbers favor sellers right now. Prices have risen for nine consecutive months, and there’s no sign of a reversal in the data.
But Rochester has a few things working in buyers’ favor. The 3.5% annual appreciation rate is moderate — not the double-digit spikes that leave buyers underwater if the market turns. The cheapest ZIP (55904) still sits under $284K, which is reachable for households earning the area’s median income.
The rent-vs-buy math in 55904 nearly breaks even, meaning buying there costs only marginally more than renting per month — with the added benefit of equity.
The risk? Rochester’s growth is accelerating and inventory doesn’t appear to be keeping pace. If population gains continue trending up as they did in 2023-2024, expect prices to follow.
If you can buy in the $280K-$320K range in 55904 or 55901, the value proposition is solid. The $460K price tag in 55902 is harder to justify unless you’re committed to that specific area long-term.
Rochester Housing Market Outlook for 2026-2027
The 12-month trend shows steady, unbroken appreciation since June 2025. Monthly gains peaked around $1,900 in the fall, then moderated to roughly $1,100 in early 2026.
If the current pace continues, Rochester’s median could reach the $370K-$375K range by mid-2026. The seasonal pattern suggests gains may accelerate again in late spring as buying activity picks up.
The population data supports continued demand. Rochester added nearly 1,000 residents in 2024, the strongest single-year gain in the dataset. Mayo Clinic remains a powerful economic anchor that draws steady migration.
There’s nothing in the trend data pointing toward a price correction. The most likely scenario for 2026-2027 is continued appreciation in the 3-5% annual range, barring a significant change in mortgage rates or local employment.
Similar Markets in MN
If you’re considering Rochester, these Minnesota cities offer useful comparisons:
- Minneapolis — The state’s largest market, with more inventory and price variety than Rochester.
- Saint Paul — Twin Cities buyers often find lower entry prices here than in Minneapolis proper.
- Duluth — Similar population growth rate (1.5%) and a smaller-city feel, about three hours north.
- Saint Cloud — A smaller metro that typically runs below Rochester’s price point.
- Eden Prairie — A Twin Cities suburb for buyers who want newer housing stock and strong schools.
Frequently Asked Questions
What is the average home price in Rochester?
The average home price in Rochester, MN is $362,722 as of February 2026. That figure represents the Zillow Home Value Index, which tracks typical home values in the 35th to 65th percentile range. Across the city’s four ZIP codes, prices range from $283,567 to $460,950.
Are home prices going up or down in Rochester?
Prices are going up. Rochester’s median home value rose 3.5% year over year as of February 2026. The market has posted monthly gains for nine straight months, adding a total of $12,249 since March 2025.
Is it cheaper to rent or buy in Rochester?
Renting is cheaper on a monthly basis in all four ZIP codes. The closest gap is in 55904, where rent ($1,655) is only about $155 less than an estimated mortgage payment ($1,810). The widest gap is in 55902, where renting saves roughly $1,262 per month compared to buying.
What is the most affordable neighborhood in Rochester?
ZIP code 55904 is the most affordable at $283,567 — about 22% below the city median. It’s the only ZIP in Rochester priced under $300K, making it the most accessible entry point for first-time buyers.
Methodology
Home values are based on the Zillow Home Value Index (ZHVI), a smoothed measure of typical home values in the 35th to 65th percentile range. Rent estimates use the Zillow Observed Rent Index (ZORI). Population figures come from the U.S. Census Bureau Population Estimates Program (2020-2024 vintage). All datasets are publicly available. Housing data updated 2026-02-28.