El Cajon Home Prices: $821K, Down 1.9% — 3 ZIPs Analyzed (2026)
$820,709. That’s what a typical home costs in El Cajon right now — and it’s actually less than it was a year ago. Prices have slipped 1.9% year over year, a rare dip in a San Diego County suburb where values climbed steadily for years. The city is also losing residents, down 2.6% since 2020.
Quick answer: The average home price in El Cajon, CA is $820,709 as of February 2026, down 1.9% year over year according to Zillow.
Current Home Prices in El Cajon
The median home value in El Cajon sits well above the national average but below many of its San Diego metro neighbors. Here’s the current snapshot:
| Metric | Value |
|---|---|
| Median Home Value | $820,709 |
| Year-Over-Year Change | -1.9% |
| Lowest ZIP Median | $770,296 |
| Highest ZIP Median | $864,908 |
| Number of ZIP Codes | 3 |
| Data as of | February 2026 |
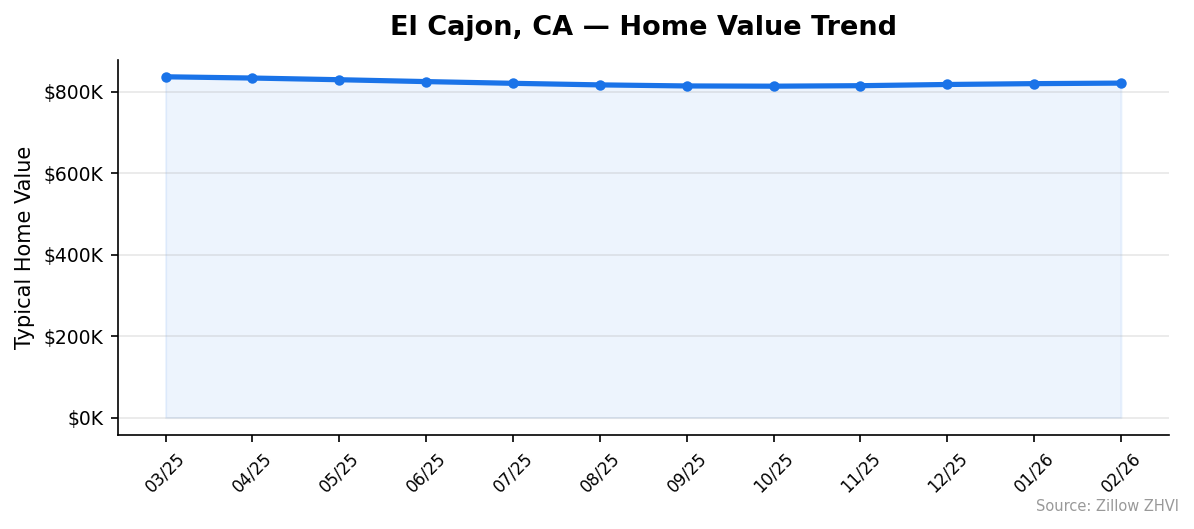
That 1.9% annual decline translates to roughly $15,500 in lost value for the typical homeowner over the past 12 months. The city peaked near $836,197 in March 2025 and has been gradually cooling since.
El Cajon’s price range spans about $95,000 from its cheapest to most expensive ZIP code. That’s a relatively tight band for a city of 103,000 people, meaning buyers face similarly high prices across most neighborhoods.
The current median puts El Cajon in the San Diego-Chula Vista-Carlsbad metro area, where home prices regularly exceed $800,000. For buyers priced out of coastal San Diego, El Cajon offers a modest discount — but “affordable” is relative when the entry point is north of $770,000.
El Cajon Home Prices by Neighborhood
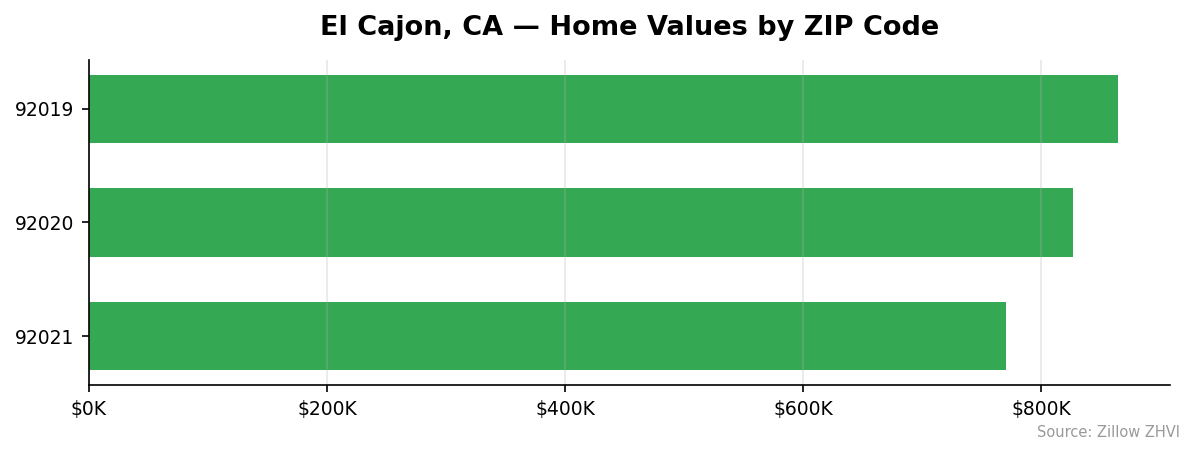
El Cajon has three ZIP codes, each with distinct pricing. Here’s how they compare:
| ZIP Code | Median Home Value | Median Rent |
|---|---|---|
| 92019 | $864,908 | $2,596/mo |
| 92020 | $826,924 | $2,272/mo |
| 92021 | $770,296 | $2,186/mo |
Most Expensive
92019 tops the list at $864,908 — about $44,000 above the city average. Rents here are also the highest at $2,596 per month, suggesting stronger demand and likely newer or more desirable housing stock.
Most Affordable
92021 is the least expensive ZIP at $770,296, roughly $50,000 below the city median. Rent is correspondingly lower at $2,186 per month. For buyers stretching to enter the El Cajon market, 92021 offers the lowest barrier to entry.
The gap between 92019 and 92021 is about $94,600 — nearly a $100,000 difference for staying within the same city. Rent tracks the same pattern: the most expensive ZIP charges $410 more per month than the cheapest.
Rent vs Buy in El Cajon
Renting is dramatically cheaper than buying right now.
The average rent across El Cajon’s three ZIP codes comes to roughly $2,351 per month. Here’s what each ZIP looks like:
| ZIP Code | Monthly Rent |
|---|---|
| 92019 | $2,596 |
| 92020 | $2,272 |
| 92021 | $2,186 |
Now compare that to buying. A mortgage on the median $820,709 home with 20% down ($164,142) at a 7% interest rate would run approximately $4,370 per month in principal and interest alone. Add property taxes, insurance, and maintenance, and you’re looking at $5,500 or more.
That’s a gap of roughly $3,000 per month between renting and owning — before you build any equity.
For buyers who can handle the monthly cost, ownership locks in a fixed payment while rents tend to rise. But the math strongly favors renters in the short term. You’d need significant price appreciation to justify the premium of buying at today’s prices.
Population Growth and Migration
El Cajon is losing people. The city’s population has declined every year since 2020.
| Year | Population |
|---|---|
| 2020 | 106,087 |
| 2021 | 105,095 |
| 2022 | 104,184 |
| 2023 | 103,522 |
| 2024 | 103,291 |
From 2020 to 2024, El Cajon lost 2,796 residents — a 2.6% decline. The pace of loss has slowed (only 231 people left between 2023 and 2024), but the trend is still negative.
Compare that to other California cities:
| City | 2024 Population | 4-Year Growth |
|---|---|---|
| San Diego | 1,404,452 | +1.4% |
| Fresno | 550,105 | +1.4% |
| Sacramento | 535,798 | +1.9% |
| Oakland | 443,554 | +0.6% |
| Bakersfield | 417,468 | +3.0% |
| El Cajon | 103,291 | -2.6% |
El Cajon is the only city on this list that’s shrinking. Every comparison city is growing, with Bakersfield adding residents at 3.0%.
A declining population typically reduces housing demand, which may partly explain the 1.9% year-over-year price drop. Fewer people competing for homes means less upward pressure on prices.
El Cajon Housing Market Trends
Here’s how the median home value has moved month by month over the past year:
| Month | Median Value | Change from Prior Month |
|---|---|---|
| March 2025 | $836,197 | — |
| April 2025 | $833,135 | -$3,062 |
| May 2025 | $828,991 | -$4,144 |
| June 2025 | $824,399 | -$4,592 |
| July 2025 | $820,200 | -$4,199 |
| August 2025 | $816,335 | -$3,865 |
| September 2025 | $813,717 | -$2,618 |
| October 2025 | $813,152 | -$565 |
| November 2025 | $814,351 | +$1,199 |
| December 2025 | $817,324 | +$2,973 |
| January 2026 | $819,394 | +$2,070 |
| February 2026 | $820,709 | +$1,315 |
The pattern is clear: prices fell steadily from March through October 2025, losing about $23,000 over seven months. Then the market turned. November marked the first monthly gain, and prices have climbed for four consecutive months since.
The recovery has been modest — about $7,500 from the October low. The current $820,709 is still $15,500 below the March 2025 peak.
Is El Cajon a Good Place to Buy in 2026?
The data paints a mixed picture.
On the positive side, prices have stabilized after a seven-month slide. Four straight months of gains suggest the bottom may be in. Buyers today are getting about $15,000 off the March 2025 peak — a small but real discount.
On the other hand, the year-over-year number is still negative at -1.9%. Population is declining. And the rent-vs-buy math heavily favors renting, with a roughly $3,000 monthly gap.
El Cajon works best for buyers who plan to hold long-term and want to be in the San Diego metro without paying San Diego prices. If you’re buying for the next 7-10 years, the current dip could look like a good entry point in hindsight. If you’re looking for quick appreciation, the data doesn’t support that expectation right now.
El Cajon Housing Market Outlook for 2026-2027
The four-month upward streak from November 2025 through February 2026 suggests prices are stabilizing. Monthly gains have averaged about $1,900 during this recovery phase.
If the current pace continues, El Cajon could recover to its March 2025 peak of $836,197 by mid-to-late 2026. But the gains are decelerating — February’s $1,315 increase was the smallest of the four-month streak.
The declining population works against a strong rebound. With fewer residents each year, demand growth is limited. The most likely scenario for the next 6-12 months is a slow grind upward, with prices hovering in the $815,000 to $835,000 range.
Similar Markets in CA
If you’re exploring options beyond El Cajon, these California cities offer different price points:
- San Diego — The bigger neighbor with a larger inventory and metro-level amenities
- Chula Vista — Another South County option in the same metro area
- Riverside — Inland Empire pricing that’s typically lower than San Diego County
- Fontana — Further inland with prices well below El Cajon’s median
- Bakersfield — Significantly more affordable, and one of California’s fastest-growing cities
Frequently Asked Questions
What is the average home price in El Cajon?
The average home price in El Cajon is $820,709 as of February 2026. Across the city’s three ZIP codes, values range from $770,296 in 92021 to $864,908 in 92019. That puts El Cajon below the San Diego metro average but well above national figures.
Are home prices going up or down in El Cajon?
Year over year, prices are down 1.9%. But the monthly trend tells a different story. After falling for seven straight months through October 2025, prices have risen for four consecutive months. The market appears to be recovering from a mid-year dip.
Is it cheaper to rent or buy in El Cajon?
Renting is much cheaper. Average rent across El Cajon is roughly $2,351 per month. A mortgage on the median-priced home would cost approximately $4,370 per month (20% down, 7% rate) before taxes and insurance. That’s a $2,000+ monthly gap favoring renters.
What is the most affordable neighborhood in El Cajon?
ZIP code 92021 has the lowest median home value at $770,296 — about $50,000 below the city average. Rent in 92021 is also the cheapest at $2,186 per month. It’s the best entry point for budget-conscious buyers looking in El Cajon.
Is El Cajon growing or shrinking?
El Cajon is shrinking. Population dropped from 106,087 in 2020 to 103,291 in 2024, a loss of 2,796 residents (-2.6%). The rate of decline has slowed in recent years but remains negative.
Methodology
Home values are based on the Zillow Home Value Index (ZHVI), a smoothed measure of typical home values in the 35th to 65th percentile range. Rent estimates use the Zillow Observed Rent Index (ZORI). Population figures come from the U.S. Census Bureau Population Estimates Program (2020-2024 vintage). All datasets are publicly available. Housing data updated 2026-02-28.