Elk Grove Home Prices: $634K, Down 3.2% — 3 ZIPs Analyzed (2026)
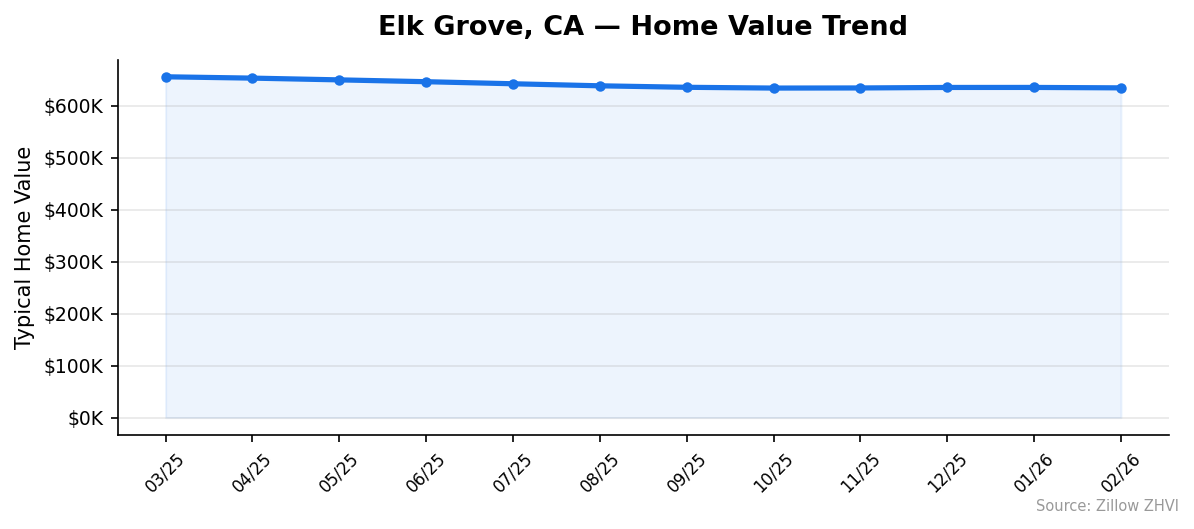
Can you still afford a house in Elk Grove? At $633,932, the typical home here costs more than double the national median. But prices are falling. Down 3.2% from a year ago, Elk Grove is giving back some of the gains that pushed values near $700K in early 2025.
Quick answer: The average home price in Elk Grove, CA is $633,932 as of February 2026, down 3.2% year over year according to Zillow.
Current Home Prices in Elk Grove
| Metric | Value |
|---|---|
| Median Home Price | $633,932 |
| Year-over-Year Change | -3.2% |
| Lowest ZIP Median | $572,249 |
| Highest ZIP Median | $695,350 |
| Number of ZIPs Tracked | 3 |
| Data as of | February 2026 |
The median home in Elk Grove has shed roughly $21,000 since March 2025, when values peaked at $655,211. That’s a decline of about $1,750 per month over the past twelve months.
The gap between the cheapest and most expensive neighborhoods is $123,101. That spread gives buyers real options depending on budget. A household earning $120,000 a year faces a very different monthly payment in the 95758 ZIP versus the 95757 ZIP.
For context, Elk Grove sits within the Sacramento-Roseville-Folsom metro area. It remains pricier than many Sacramento suburbs, but the current pullback is the first sustained decline the city has seen in this cycle.
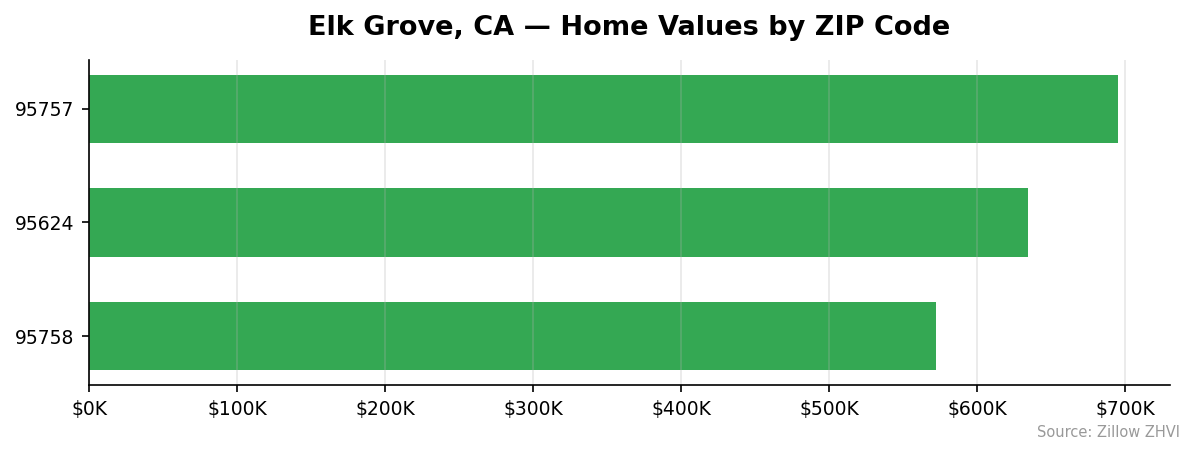
Elk Grove Home Prices by Neighborhood
| ZIP Code | Median Home Value | Avg. Monthly Rent |
|---|---|---|
| 95757 | $695,350 | $2,786 |
| 95624 | $634,198 | $2,718 |
| 95758 | $572,249 | $2,503 |
Most Expensive
95757 tops the list at $695,350 — about 9.7% above the city median. Rents here also run highest at $2,786 per month, reflecting the newer housing stock in this part of town.
Most Affordable
95758 comes in at $572,249, roughly $62,000 below the city average. Rent is also the lowest of the three ZIPs at $2,503 per month. Buyers on a tighter budget will find the most room here — the price gap between 95758 and 95757 is over $123,000.
95624 falls right in the middle at $634,198. It tracks almost exactly with the citywide median, making it the baseline for Elk Grove pricing.
Rent vs Buy in Elk Grove
Average rent across Elk Grove’s three tracked ZIP codes runs about $2,669 per month. The cheapest option is 95758 at $2,503. The most expensive is 95757 at $2,786.
Now compare that to buying. A conventional mortgage on a $633,932 home with 20% down ($126,786) means financing roughly $507,146. At a 7% rate on a 30-year fixed loan, the principal and interest payment alone is about $3,374 per month. Add property taxes (roughly 1.1% in Sacramento County) and homeowner’s insurance, and you’re looking at $4,000 or more each month.
| Renting | Buying | |
|---|---|---|
| Monthly Cost | ~$2,669 | ~$4,000+ |
| Upfront Cost | Security deposit | ~$127K down payment |
| Builds Equity | No | Yes |
The math favors renting right now — by roughly $1,300 per month. That gap has widened as prices rose in previous years while rates stayed elevated. Buyers do build equity, but only if values hold or increase. With prices currently dropping 3.2% annually, that equity cushion is shrinking.
Population Growth and Migration
Elk Grove’s population reached 182,797 in 2024, up 3.5% from 176,579 in 2020. That’s an addition of roughly 6,200 residents in four years.
| Year | Population |
|---|---|
| 2020 | 176,579 |
| 2021 | 177,966 |
| 2022 | 178,468 |
| 2023 | 179,843 |
| 2024 | 182,797 |
Growth accelerated in 2024, with nearly 3,000 new residents in a single year — the largest annual gain in the series. The earlier years averaged about 700-900 new residents annually.
How does Elk Grove compare to other California cities?
| City | 2024 Population | 4-Year Growth |
|---|---|---|
| Elk Grove | 182,797 | 3.5% |
| Bakersfield | 417,468 | 3.0% |
| Sacramento | 535,798 | 1.9% |
| San Diego | 1,404,452 | 1.4% |
| Fresno | 550,105 | 1.4% |
| Oakland | 443,554 | 0.6% |
Elk Grove is growing faster than Sacramento, its metro anchor. It’s also outpacing every major California city on this list. Sustained population growth typically supports housing demand — which makes the current 3.2% price decline worth watching. It suggests the drop is driven by affordability constraints and rate pressure rather than people leaving.
Elk Grove Housing Market Trends
| Month | Average Value | Low ZIP | High ZIP |
|---|---|---|---|
| Mar 2025 | $655,211 | $593,252 | $720,474 |
| Apr 2025 | $652,644 | $590,291 | $718,515 |
| May 2025 | $649,272 | $586,653 | $715,499 |
| Jun 2025 | $645,760 | $583,090 | $712,015 |
| Jul 2025 | $641,801 | $579,244 | $707,629 |
| Aug 2025 | $637,868 | $575,827 | $702,773 |
| Sep 2025 | $635,010 | $573,320 | $698,939 |
| Oct 2025 | $633,523 | $571,996 | $696,577 |
| Nov 2025 | $633,746 | $572,165 | $696,084 |
| Dec 2025 | $634,704 | $573,001 | $696,614 |
| Jan 2026 | $634,747 | $573,104 | $696,223 |
| Feb 2026 | $633,932 | $572,249 | $695,350 |
The trend line tells a clear story. Prices fell steadily from March through October 2025 — seven consecutive months of declines. Then values flattened. November, December, and January were essentially flat, hovering in the $633K-$635K range. February dipped slightly again.
The steepest monthly drop came between May and June 2025, when values fell about $3,500. The most expensive ZIP saw an even bigger swing, dropping from $720,474 in March to $695,350 in February — a $25,124 decline over twelve months.
Is Elk Grove a Good Place to Buy in 2026?
The numbers point to a buyer-friendlier market than what Elk Grove has seen in years. Prices are down 3.2%, and the decline has been steady — not a sudden crash, but a gradual reset.
For buyers: you have the upper hand. Sellers who listed at 2025 peak prices are now sitting on homes that have lost value for nearly a year. The flat stretch from November through January suggests a floor may be forming near the $634K mark.
For sellers: the window of maximum pricing power has closed. Holding out for $655K or above means fighting the trend.
The rent-versus-buy gap is still wide. Unless you have significant savings for a down payment, renting remains cheaper month to month. But if you plan to stay five-plus years and can stomach the near-term depreciation, buying during a soft market has historically paid off.
Elk Grove’s population growth is a long-term tailwind. More people means more demand eventually. The question is timing.
Elk Grove Housing Market Outlook for 2026-2027
The three-month trend from December through February shows almost no movement — values shifted less than $800 total. That flattening after a sustained decline suggests the market is finding a price floor.
If the current pace continues, expect prices to hover in the $630K-$635K range through spring and summer 2026. Seasonal buying activity could push values up slightly, but the year-over-year trend would need to reverse sharply for prices to reclaim the $650K+ levels seen in early 2025.
The most likely scenario: sideways movement. The steep part of the correction appears over. Barring a significant drop in mortgage rates or a surge in inventory, Elk Grove is settling into a holding pattern.
Similar Markets in CA
- Elk Grove buyers exploring cheaper options might consider Bakersfield, where Central Valley prices run well below Sacramento-area levels.
- Fresno offers another Central Valley alternative with similar population growth but lower home values.
- For coastal living at a premium, San Diego provides a benchmark for how much farther California prices can stretch.
- Riverside in the Inland Empire is another Sacramento alternative for families priced out of the Bay Area.
- Fontana rounds out the Southern California comparison for buyers willing to trade location for value.
Frequently Asked Questions
What is the average home price in Elk Grove?
The average home price in Elk Grove is $633,932 as of February 2026. This is based on the Zillow Home Value Index, which measures typical values in the 35th to 65th percentile range. Prices vary by ZIP from $572,249 to $695,350.
Are home prices going up or down in Elk Grove?
Prices are down 3.2% year over year. The decline started in March 2025, when the median was $655,211, and has continued through February 2026. The rate of decline slowed significantly in the last three months, with prices nearly flat since November.
Is it cheaper to rent or buy in Elk Grove?
Renting is cheaper right now. Average rent across Elk Grove runs about $2,669 per month, while a mortgage on a median-priced home (with 20% down at 7%) costs roughly $4,000 or more per month including taxes and insurance. That’s a gap of over $1,300 monthly.
What is the most affordable neighborhood in Elk Grove?
ZIP code 95758 is the most affordable, with a median value of $572,249 — about $62,000 below the citywide average. Rent here averages $2,503 per month, also the lowest in the city.
Methodology
Home values are based on the Zillow Home Value Index (ZHVI), a smoothed measure of typical home values in the 35th to 65th percentile range. Rent estimates use the Zillow Observed Rent Index (ZORI). Population figures come from the U.S. Census Bureau Population Estimates Program (2020-2024 vintage). All datasets are publicly available. Housing data updated 2026-02-28.