Dearborn Home Prices: $251K, Up 4.5% — 4 ZIPs Analyzed (2026)
$251,206. That’s what a typical home costs in Dearborn right now — and it’s climbing. Prices rose 4.5% over the past year, with every single month posting a gain. In a metro where Detroit grabs the headlines, Dearborn has been quietly getting more expensive.
Quick answer: The average home price in Dearborn, MI is $251,206 as of February 2026, up 4.5% year over year according to Zillow.
Current Home Prices in Dearborn
| Metric | Value |
|---|---|
| Median Home Value | $251,206 |
| Year-over-Year Change | +4.5% |
| Lowest ZIP Median | $227,799 |
| Highest ZIP Median | $298,019 |
| Number of ZIPs Tracked | 4 |
| Data as of | February 2026 |
A $251K median puts Dearborn in a different bracket than its neighbor Detroit. The price range across the city’s four ZIP codes spans about $70,000 — a gap that means your neighborhood choice matters more than timing the market.
The 4.5% annual gain translates to roughly $10,800 in added value over the past year. That’s real equity for homeowners who bought even 12 months ago. For buyers, it means waiting has a measurable cost.
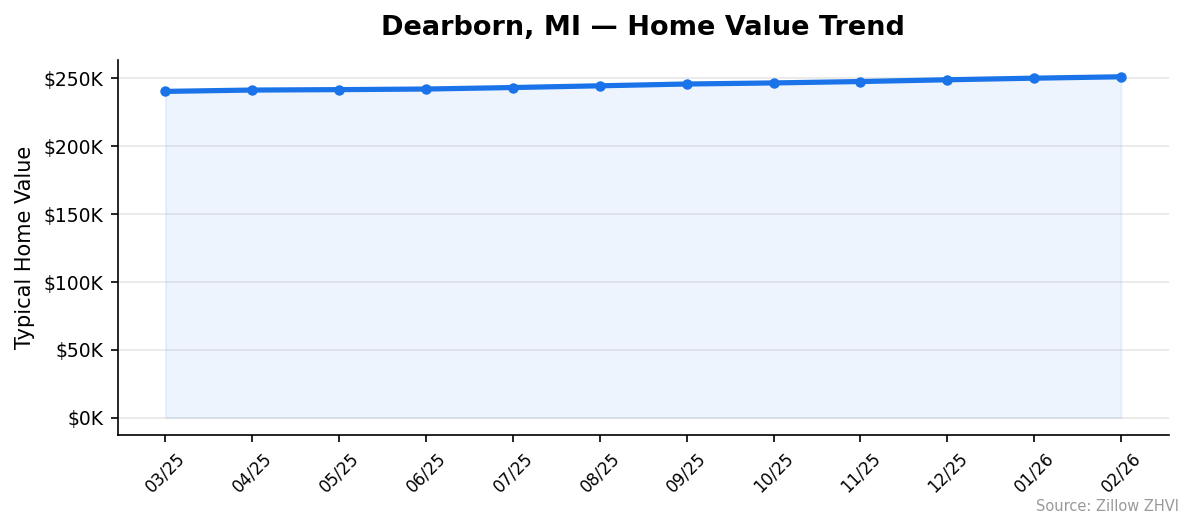
Dearborn hasn’t had a single down month in the past year. From $240,445 in March 2025 to $251,206 in February 2026, the trend line has been a straight climb. No dips. No plateaus.
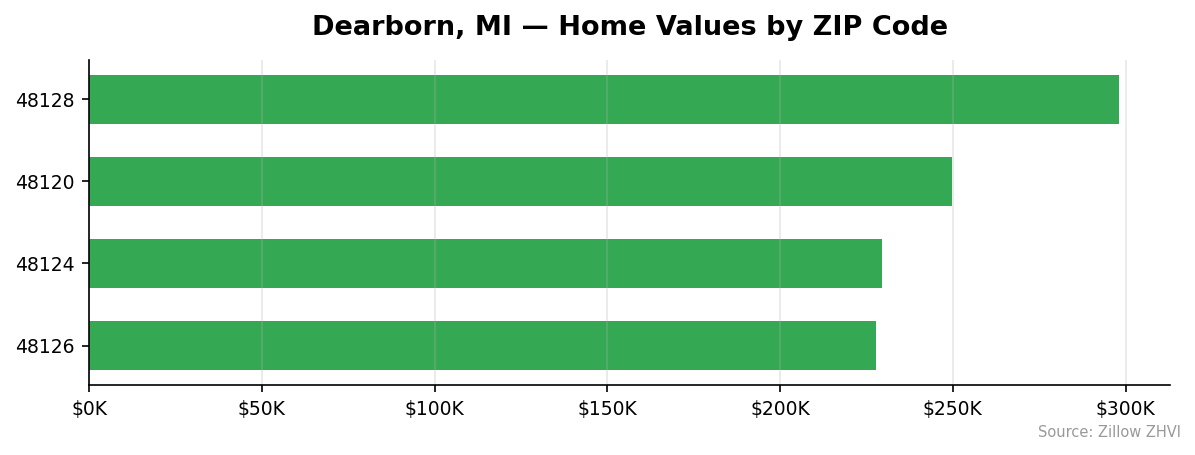
Dearborn Home Prices by Neighborhood
| ZIP Code | Median Home Value | vs. City Median |
|---|---|---|
| 48126 | $227,799 | -9.3% |
| 48124 | $229,374 | -8.7% |
| 48120 | $249,632 | -0.6% |
| 48128 | $298,019 | +18.6% |
Most Expensive
48128 leads the city at $298,019 — nearly $47,000 above the city median and the only ZIP to crack the upper $200Ks. This area commands an 18.6% premium over the Dearborn average.
Most Affordable
48126 is the cheapest entry point at $227,799, sitting 9.3% below the city median. Rent data is available here at $1,733/month. Close behind is 48124 at $229,374, where rents run $1,746/month. Both ZIPs offer a way into Dearborn for under $230K.
The spread between the priciest and cheapest ZIP is $70,220. For a city with only four tracked ZIPs, that’s a meaningful gap — you can save nearly 24% by choosing the right neighborhood.
Rent vs Buy in Dearborn
Rent data is available for two of Dearborn’s four ZIP codes.
| ZIP Code | Median Home Value | Avg Monthly Rent |
|---|---|---|
| 48126 | $227,799 | $1,733 |
| 48124 | $229,374 | $1,746 |
Here’s the rough math. A 20% down payment on a $251,206 home is $50,241, leaving a $200,965 mortgage. At a 7% rate over 30 years, the monthly principal and interest payment comes to approximately $1,337.
That’s $396–$409 less per month than renting in the ZIPs where data is available. Of course, homeowners also pay property taxes, insurance, and maintenance — costs that can add $400–$600 per month depending on the property.
Even factoring in those extras, buying and renting end up in a similar range in Dearborn. The difference is that mortgage payments build equity while rent payments don’t. With prices rising 4.5% annually, homeowners gained roughly $11,000 in equity over the past year on top of their principal paydown.
If you can clear the down payment hurdle, buying has the edge here.
Population Growth and Migration
Dearborn is losing residents. The city’s population fell from 109,555 in 2020 to 106,377 in 2024 — a 2.9% decline over four years.
| Year | Population | Change |
|---|---|---|
| 2020 | 109,555 | — |
| 2021 | 108,226 | -1,329 |
| 2022 | 106,748 | -1,478 |
| 2023 | 106,245 | -503 |
| 2024 | 106,377 | +132 |
The trend is worth watching closely. The steepest drops came in 2021 and 2022. By 2023, the decline slowed to just 503 people. Then in 2024, Dearborn added 132 residents — the first gain in the four-year window. The bleeding may have stopped.
Compare that to other Michigan cities:
| City | 2024 Population | 4-Year Growth |
|---|---|---|
| Detroit | 645,705 | +1.1% |
| Grand Rapids | 200,117 | +0.7% |
| Lansing | 114,336 | +1.6% |
| Troy | 89,209 | +2.4% |
| Farmington Hills | 84,173 | +0.4% |
| Dearborn | 106,377 | -2.9% |
Dearborn is the only city in this group that lost population. Yet prices still rose 4.5%. That tells you housing demand isn’t driven by population alone — proximity to Detroit’s job centers, school quality, and limited housing stock all play a role.
Dearborn Housing Market Trends
Here’s how prices moved month by month over the past year:
| Month | Average Value | Monthly Change |
|---|---|---|
| Mar 2025 | $240,445 | — |
| Apr 2025 | $241,436 | +$991 |
| May 2025 | $241,735 | +$299 |
| Jun 2025 | $242,184 | +$449 |
| Jul 2025 | $243,286 | +$1,102 |
| Aug 2025 | $244,565 | +$1,279 |
| Sep 2025 | $245,884 | +$1,319 |
| Oct 2025 | $246,672 | +$788 |
| Nov 2025 | $247,706 | +$1,034 |
| Dec 2025 | $249,004 | +$1,298 |
| Jan 2026 | $250,192 | +$1,188 |
| Feb 2026 | $251,206 | +$1,014 |
Twelve consecutive months of gains. Not a single negative reading.
The pace picked up noticeably in the summer and fall months. July through September saw the largest monthly jumps, with September adding $1,319. Spring months were the slowest — May gained just $299.
Over the full 12-month window, Dearborn added $10,761 in value. That works out to an average of $897 per month. The acceleration from spring into summer follows the typical seasonal pattern, but the gains held through winter too. That’s not always the case.
Is Dearborn a Good Place to Buy in 2026?
The data points toward a seller’s market. Twelve straight months of price gains, a tight range of only four tracked ZIPs, and prices rising despite population loss — that’s a market where demand outstrips supply.
For buyers, the math still works at certain price points. The 48126 and 48124 ZIPs offer homes under $230K, where monthly mortgage payments undercut local rents. If you’re already renting in Dearborn and paying $1,733–$1,746, buying in those same neighborhoods could save you money each month while building equity.
The risk is that 4.5% annual appreciation makes waiting expensive. Every month you wait costs roughly $900 in price increases based on the recent trend.
Buyers with a down payment ready and plans to stay five-plus years are in the strongest position. Short-term buyers face more risk if the pace of appreciation slows.
Dearborn Housing Market Outlook for 2026-2027
The 12-month trend shows no signs of reversal. Monthly gains have been consistent, averaging around $1,000 per month in the most recent quarter (December through February).
If the current pace continues, Dearborn’s median could reach the $255,000–$260,000 range by mid-2026. The summer months historically bring stronger gains, which could push that higher.
The 2024 population rebound — small as it was at 132 people — could signal stabilizing demand. If Dearborn’s population truly bottomed out, housing demand may firm up further.
The main risk to watch: mortgage rates. The 4.5% appreciation happened during a high-rate environment. If rates stay elevated, the pace of gains could moderate. But the data so far shows Dearborn absorbing high rates without a price correction.
Similar Markets in MI
If you’re considering Dearborn, these Michigan cities offer comparison points:
- Detroit — Dearborn’s immediate neighbor with a much larger market and different price dynamics.
- Ann Arbor — A university town about 35 miles west, typically at a higher price point.
- Sterling Heights — Another Detroit-metro suburb on the north side for a direct suburban comparison.
- Livonia — Borders Dearborn to the north and shares a similar suburban profile.
- Grand Rapids — West Michigan’s largest city, growing at 0.7%, for buyers open to leaving the Detroit metro.
Frequently Asked Questions
What is the average home price in Dearborn?
The average home price in Dearborn is $251,206 as of February 2026. Prices range from $227,799 in the 48126 ZIP code to $298,019 in the 48128 ZIP code. The city-wide median has increased every month for the past year.
Are home prices going up or down in Dearborn?
Prices are going up. Dearborn home values increased 4.5% year over year. The market posted gains in all 12 months tracked, with the strongest growth in the summer and fall months. There has been no monthly decline in the data window.
Is it cheaper to rent or buy in Dearborn?
On a pure payment basis, buying is cheaper. A mortgage on the median home runs about $1,337/month (20% down, 7% rate), while rents in the two ZIPs with data average $1,733–$1,746. Add in taxes, insurance, and maintenance, and the monthly costs are roughly comparable — but buying builds equity.
What is the most affordable neighborhood in Dearborn?
ZIP code 48126 is the most affordable at $227,799, about $23,400 below the city median. The neighboring 48124 ZIP is close behind at $229,374. Both offer entry prices under $230,000 and have available rent data showing monthly rents in the $1,733–$1,746 range.
Methodology
Home values are based on the Zillow Home Value Index (ZHVI), a smoothed measure of typical home values in the 35th to 65th percentile range. Rent estimates use the Zillow Observed Rent Index (ZORI). Population figures come from the U.S. Census Bureau Population Estimates Program (2020-2024 vintage). All datasets are publicly available. Housing data updated 2026-02-28.