Fargo Home Prices: $308K, Up 3.8% — 3 ZIPs Analyzed (2026)
$308K. That’s what a typical home costs in Fargo right now, and prices haven’t stopped climbing. Over the past year, values rose 3.8% while the city added thousands of new residents. For a mid-sized Great Plains city, Fargo’s housing market is running hotter than most buyers expect.
Quick answer: The average home price in Fargo, ND is $307,534 as of February 2026, up 3.8% year over year according to Zillow.
Current Home Prices in Fargo
The Fargo housing market entered 2026 on a steady upward path. Here’s where things stand:
| Metric | Value |
|---|---|
| Median Home Price | $307,534 |
| Year-over-Year Change | +3.8% |
| Lowest ZIP Median | $262,884 |
| Highest ZIP Median | $393,626 |
| ZIP Codes Tracked | 3 |
| Data As Of | February 2026 |
A 3.8% annual gain puts Fargo in moderate-growth territory. Prices aren’t surging, but they aren’t flat either. The $130,742 gap between the cheapest and most expensive ZIP codes means your neighborhood pick matters. A buyer targeting the 58103 area saves roughly $131K compared to 58104.
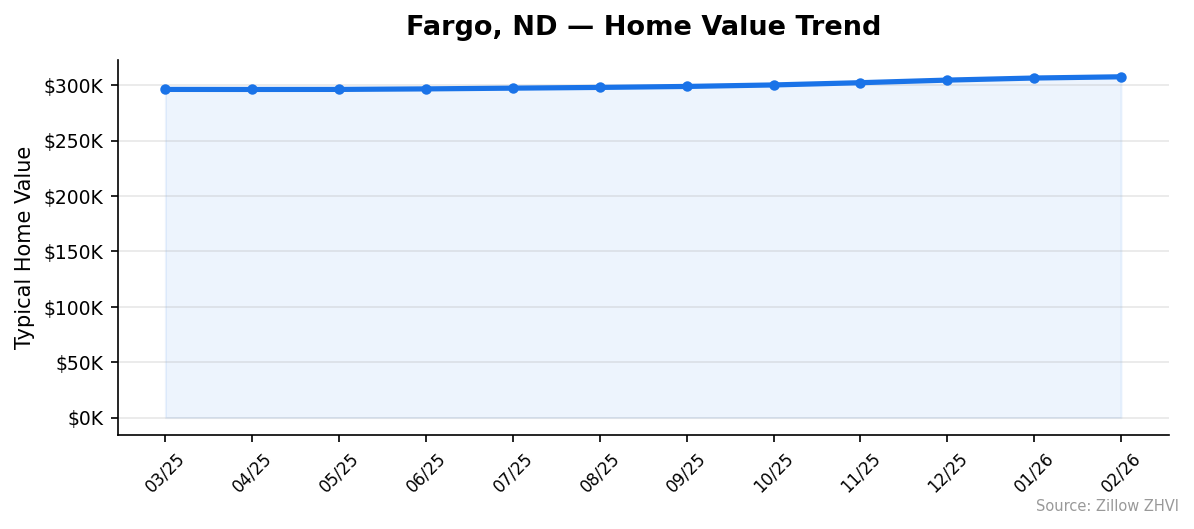
Over the past 12 months, the median moved from $296,151 in March 2025 to $307,534 in February 2026. That’s an $11,383 increase — about $948 per month. The pace of appreciation accelerated in late 2025 and early 2026 after a relatively flat stretch through spring and summer 2025.
Fargo remains well below the national median, which hovered near $360K during the same period. Buyers priced out of larger metros will find more room here.
Fargo Home Prices by Neighborhood
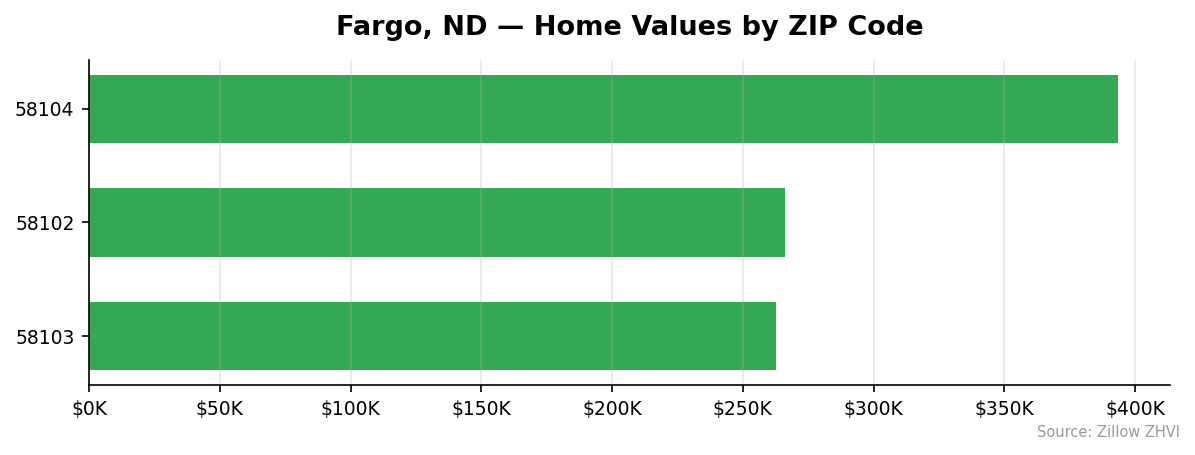
Three ZIP codes cover the Fargo market. The price differences are substantial for a city this size.
| ZIP Code | Median Home Value | Avg. Monthly Rent |
|---|---|---|
| 58103 | $262,884 | $840 |
| 58102 | $266,091 | $1,118 |
| 58104 | $393,626 | $1,236 |
Most Expensive
58104 tops the list at $393,626 — 28% above the city median. Rents here are also the highest at $1,236 per month, suggesting this ZIP draws higher-income households and newer construction.
Most Affordable
58103 comes in at $262,884, roughly 15% below the city median. It also has the lowest rent at $840 per month, making it the clear budget pick for both renters and buyers.
58102 sits just above 58103 at $266,091, but rent is noticeably higher at $1,118. That rent-to-price mismatch could make 58102 more attractive for investors than owner-occupants.
Rent vs Buy in Fargo
Monthly rents across Fargo range from $840 to $1,236. How does that compare to buying?
A rough mortgage estimate on a $307,534 home with 20% down at a 6.5% rate gives you a monthly payment around $1,960 — principal and interest only. Add property taxes and insurance, and you’re likely above $2,200.
| ZIP Code | Monthly Rent | Est. Mortgage (20% Down, 6.5%) |
|---|---|---|
| 58103 | $840 | ~$1,670 |
| 58102 | $1,118 | ~$1,690 |
| 58104 | $1,236 | ~$2,500 |
Renting is cheaper across every ZIP code. In 58103, rent is half the estimated mortgage payment. Even in 58104, where rents are highest, you’d save roughly $1,264 per month by renting.
That doesn’t mean buying is a bad idea. Home values rose 3.8% last year. On a $308K home, that’s about $11,700 in equity gains. But the monthly cash flow gap is real, and buyers need to weigh that against long-term appreciation.
For someone planning to stay fewer than five years, renting likely wins. Stay longer, and the equity math starts to shift.
Population Growth and Migration
Fargo is one of the fastest-growing cities in North Dakota. The numbers tell a clear story.
| Year | Population |
|---|---|
| 2020 | 125,986 |
| 2021 | 129,486 |
| 2022 | 132,030 |
| 2023 | 134,360 |
| 2024 | 136,285 |
The city grew 8.2% between 2020 and 2024, adding 10,299 residents. That’s roughly 2,575 new people per year — consistent, year-after-year growth with no sign of slowing.
How does Fargo compare to other North Dakota cities?
| City | 2024 Population | 4-Year Growth |
|---|---|---|
| Fargo | 136,285 | 8.2% |
| Bismarck | 77,772 | 5.5% |
| Grand Forks | 59,845 | 1.2% |
Fargo is growing faster than both Bismarck and Grand Forks — by a wide margin over Grand Forks. That population pressure feeds directly into housing demand. More people need homes, and Fargo’s building pipeline has to keep up or prices will keep rising.
Fargo Housing Market Trends
The 12-month trend shows steady, uninterrupted growth.
| Month | Median Price | Monthly Change |
|---|---|---|
| Mar 2025 | $296,151 | — |
| Apr 2025 | $296,110 | -$41 |
| May 2025 | $296,153 | +$43 |
| Jun 2025 | $296,618 | +$465 |
| Jul 2025 | $297,288 | +$670 |
| Aug 2025 | $297,946 | +$658 |
| Sep 2025 | $298,823 | +$877 |
| Oct 2025 | $300,169 | +$1,346 |
| Nov 2025 | $302,200 | +$2,031 |
| Dec 2025 | $304,540 | +$2,340 |
| Jan 2026 | $306,414 | +$1,874 |
| Feb 2026 | $307,534 | +$1,120 |
Prices were essentially flat from March through May 2025. Then monthly gains picked up through the summer, peaking at $2,340 in December 2025. The pace slowed slightly in January and February 2026 but remained solidly positive.
The market hasn’t posted a meaningful decline in over a year. April 2025 dipped $41 — statistically nothing. Every other month was green.
Is Fargo a Good Place to Buy in 2026?
The data points to a seller’s market that’s still approachable.
At $308K, Fargo is affordable compared to most U.S. metros. The 3.8% annual appreciation isn’t extreme, but it’s consistent. Buyers won’t get crushed by price swings, and they’re unlikely to buy at a peak that immediately drops.
The population growth rate of 8.2% over four years creates real demand. Fargo isn’t a speculative market — people are moving here for jobs and staying.
Risks? Interest rates above 6% keep monthly payments elevated. And the rent-vs-buy gap means you’re paying a premium to own, at least in the short term. If rates drop, the buying math improves quickly.
For first-time buyers, 58103 offers entry below $263K. That’s achievable with moderate income.
Fargo Housing Market Outlook for 2026-2027
The three-month trend from December 2025 through February 2026 averaged about $1,778 in monthly gains. If that pace continues, Fargo’s median could approach $315K to $318K by mid-2026.
The acceleration through late 2025 suggests demand outpaced supply during the fall and winter. Spring and summer listings typically increase, which could moderate price growth — similar to the flat stretch seen in spring 2025.
Population growth provides a floor. With 2,500+ new residents arriving each year, demand isn’t going away. Barring a significant rate spike or economic shock, prices are more likely to keep grinding upward than to reverse.
The 12-month trend shows no signs of a correction. Buyers waiting for a dip haven’t seen one in the data.
Similar Markets in ND
If you’re exploring other North Dakota cities, here’s one to consider:
- Bismarck — The state capital grew 5.5% since 2020 and offers a smaller-market alternative to Fargo with lower population pressure.
Frequently Asked Questions
What is the average home price in Fargo?
The average home price in Fargo is $307,534 as of February 2026. Prices range from $262,884 in ZIP code 58103 to $393,626 in 58104. The city-wide median sits well below the national average.
Are home prices going up or down in Fargo?
Prices are going up. Fargo’s median home value increased 3.8% year over year, rising from $296,151 in March 2025 to $307,534 in February 2026. Monthly gains accelerated through late 2025.
Is it cheaper to rent or buy in Fargo?
Renting is cheaper across all three Fargo ZIP codes. The lowest rent is $840 per month in 58103, while an estimated mortgage on the same ZIP’s median home runs about $1,670. The gap narrows if you factor in equity gains of roughly 3.8% per year.
What is the most affordable neighborhood in Fargo?
ZIP code 58103 is the most affordable at $262,884 — about 15% below the city median. Rents there average $840 per month, also the lowest in the city. It’s the clear entry point for budget-conscious buyers.
Methodology
Home values are based on the Zillow Home Value Index (ZHVI), a smoothed measure of typical home values in the 35th to 65th percentile range. Rent estimates use the Zillow Observed Rent Index (ZORI). Population figures come from the U.S. Census Bureau Population Estimates Program (2020-2024 vintage). All datasets are publicly available. Housing data updated 2026-02-28.