Bismarck Home Prices: $360K, Up 5.2% — 3 ZIPs Analyzed (2026)
$360,308. That’s the typical Bismarck home price as of February 2026, up 5.2% from a year ago. Prices have climbed every single month over the past year, with no pullback in sight.
Quick answer: The average home price in Bismarck, ND is $360,308 as of February 2026, up 5.2% year over year according to Zillow.
Current Home Prices in Bismarck
The Bismarck market has done something unusual for 2026 — it kept going up while many larger metros stalled or declined. The typical home is worth $360,308. A year ago it was about $342,500. That works out to roughly $18,000 in added value over twelve months.
| Metric | Value |
|---|---|
| Median home value | $360,308 |
| Year-over-year change | +5.2% |
| Cheapest ZIP | $292,512 |
| Most expensive ZIP | $441,933 |
| Spread (max − min) | $149,421 |
| ZIP codes tracked | 3 |
| Data through | Feb 28, 2026 |
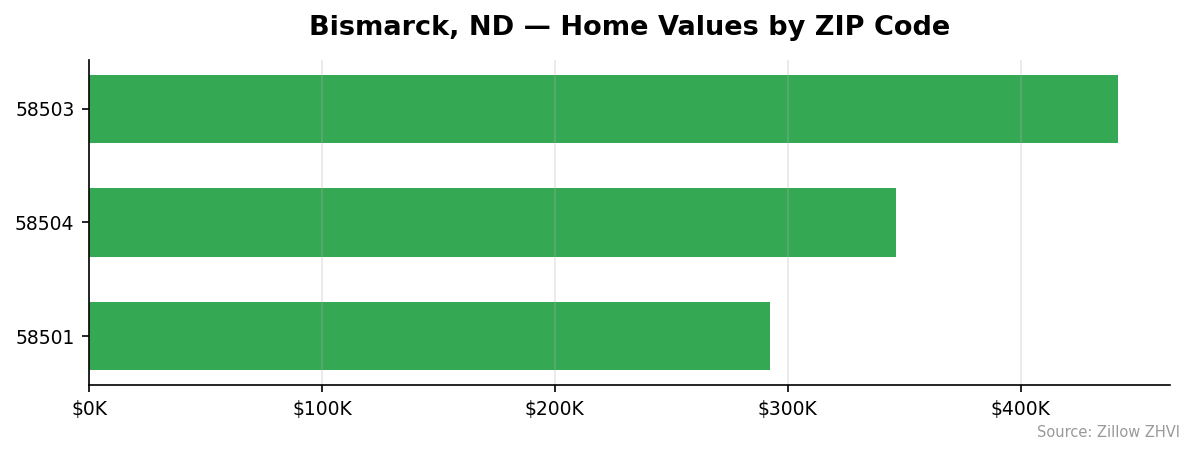
The price spread between the cheapest and priciest ZIP is about $149K — a 51% gap from bottom to top. For a city of fewer than 80,000 people, that’s a meaningful split. It tells you neighborhood matters more than the city-wide average suggests.
What it doesn’t tell you: which way each ZIP is moving. The ZHVI captures the typical home in the 35th to 65th percentile, so very high-end and very low-end sales are excluded from the median. If you’re shopping below $290K or above $445K, expect to be working in thinner inventory.
The 5.2% annual gain puts Bismarck well ahead of the national pace, which has been roughly flat to mildly negative depending on the month. North Dakota’s small population, slow new construction, and stable energy-linked economy all keep supply tight.
Bismarck Home Prices by Neighborhood
Three ZIPs cover most of Bismarck, and they sort cleanly by price.
| ZIP | Median Value | vs. City Median | Avg Rent (ZORI) |
|---|---|---|---|
| 58503 | $441,933 | +22.6% | $1,628 |
| 58504 | $346,479 | −3.8% | $1,468 |
| 58501 | $292,512 | −18.8% | $1,067 |
Most Expensive
- 58503 — $441,933. The north-side ZIP runs about $82K above the city median and commands the highest rents at $1,628 a month. It’s the only ZIP above $400K.
- 58504 — $346,479. South Bismarck sits just under the city median, with rents in the mid-$1,400s. It’s the middle option in a three-way market.
- 58501 — $292,512. Even Bismarck’s “expensive” floor is the most affordable ZIP. There is no fourth ZIP — these three define the market.
Most Affordable
- 58501 — $292,512. The downtown and older-core ZIP. Roughly $68K below the city median, with rent at $1,067 — about $560 a month less than 58503.
- 58504 — $346,479. A near-median price point. If you want suburban-style housing without paying north-side rates, this is where the math works.
- 58503 — $441,933. Even the priciest Bismarck ZIP undercuts the national median home price. “Affordable” is relative here — by national standards, every ZIP qualifies.
Rent vs Buy in Bismarck
Average rent across Bismarck’s three ZIPs lands at roughly $1,387 a month, weighted by the ZORI figures above. That’s what a typical renter pays.
Now the buy side. On a $360,308 home with 20% down ($72,062), you’d finance about $288,246. At a 7% 30-year fixed rate, principal and interest run about $1,917 a month. Add roughly $300 for property tax, $150 for insurance, and you’re at $2,367 — before any HOA or maintenance reserve.
| Cost type | Monthly |
|---|---|
| Average rent (ZORI weighted) | ~$1,387 |
| Mortgage P&I (20% down, 7%) | ~$1,917 |
| Taxes + insurance estimate | ~$450 |
| Total to own | ~$2,367 |
| Renting saves | ~$980/month |
Renting wins on cash flow by roughly $980 a month right now. That’s nearly $12K a year staying in your pocket if you rent rather than buy.
The buy case rests on appreciation. With prices up 5.2% in the past year, a $360K home gained about $18,700 in equity. If that pace holds, owners come out ahead despite the higher monthly cost. If it slows, the rent-to-own gap takes longer to close.
For shorter stays — under five years — the math favors renting in 58501 especially, where rent is just $1,067.
Population Growth and Migration
Bismarck added residents every year from 2020 to 2024.
| Year | Population |
|---|---|
| 2020 | 73,741 |
| 2021 | 74,495 |
| 2022 | 75,483 |
| 2023 | 76,389 |
| 2024 | 77,772 |
Total four-year growth: 5.5%, or about 4,000 new residents. The 2023-to-2024 gain alone was nearly 1,400 people — the biggest single-year jump in the window.
Compared to other North Dakota cities:
| City | 2024 Population | 4-Year Growth |
|---|---|---|
| Fargo | 136,285 | +8.2% |
| Bismarck | 77,772 | +5.5% |
| Grand Forks | 59,845 | +1.2% |
Fargo grew faster on a percentage basis. Grand Forks is nearly flat. Bismarck sits in the middle — steady growth, no boom, no bust.
For housing, that matters. A city adding people year after year while building little new inventory will see prices push higher. The 5.2% annual price gain and 5.5% four-year population gain are tracking together, and that’s not coincidence. Demand is real and persistent.
Bismarck Housing Market Trends
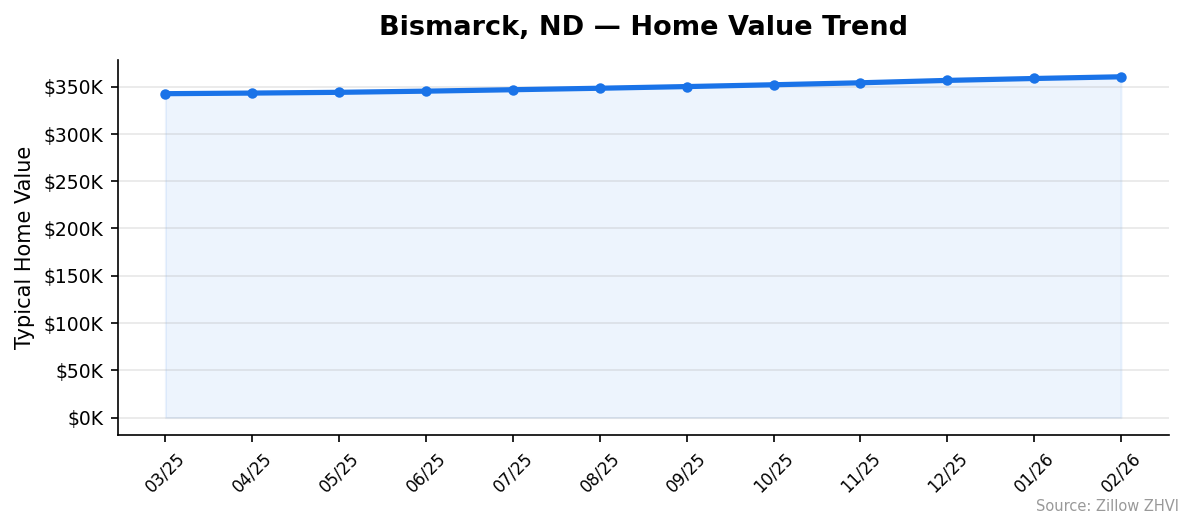
Twelve months of price data show a single direction.
| Month | Median Value |
|---|---|
| Mar 2025 | $342,444 |
| Apr 2025 | $343,087 |
| May 2025 | $343,888 |
| Jun 2025 | $345,127 |
| Jul 2025 | $346,634 |
| Aug 2025 | $348,202 |
| Sep 2025 | $349,963 |
| Oct 2025 | $351,885 |
| Nov 2025 | $353,963 |
| Dec 2025 | $356,492 |
| Jan 2026 | $358,506 |
| Feb 2026 | $360,308 |
Up. Every month. The smallest monthly gain was about $643 (March to April 2025). The largest was $2,529 (November to December 2025).
That kind of consistency is rare. Most markets bounce — a hot summer, a soft winter. Bismarck didn’t bounce. It walked steadily uphill for a full year.
Pace check: the average monthly gain over twelve months is about $1,488, or 0.43% per month. Annualized, that’s a 5.3% pace, almost exactly matching the reported YoY figure.
Is Bismarck a Good Place to Buy in 2026?
The data points to a seller’s market with no obvious crack. Twelve straight months of gains, 5.2% annual appreciation, and 5.5% population growth over four years all line up on one side of the ledger.
For buyers, that means competition and rising prices to work against. The cheapest ZIP at $292K is still well below national norms, but it has gained value alongside everything else. Waiting hasn’t paid off in this market — a buyer who waited a year paid roughly $18K more in February 2026 than February 2025.
For sellers, the case is straightforward: list prices have absorbed the gains, and demand is still there.
The rent-vs-buy gap is the one number that gives buyers pause. Owning costs roughly $980 more per month than renting at current rates. You need price appreciation to justify the premium. So far, you’ve gotten it.
Bismarck Housing Market Outlook for 2026-2027
The 3-month trend (December 2025 to February 2026) shows monthly gains of $2,014, $1,802, and $2,529. That’s an acceleration, not a slowdown.
If the current pace continues, the next two to three months should push the median past $362K, possibly toward $365K by mid-summer 2026. The momentum visible in the monthly data has not broken in a year.
What would change that? Mortgage rates moving sharply higher would slow buying. New construction picking up would ease supply. A regional economic shock — energy, agriculture — would hit demand. None of these are visible in the price data right now.
The likeliest near-term outcome based on what’s in the trend: continued gradual gains, with the year-over-year figure staying in the 4-6% range through summer.
Similar Markets in ND
If you want a larger North Dakota market with stronger population growth, consider:
- Fargo — North Dakota’s largest city, growing 8.2% over four years versus Bismarck’s 5.5%. A bigger job market with a different price profile.
Frequently Asked Questions
What is the average home price in Bismarck?
The average home price in Bismarck, ND is $360,308 as of February 2026. That figure is based on the Zillow Home Value Index across three ZIP codes — 58501, 58503, and 58504.
Are home prices going up or down in Bismarck?
Prices are up 5.2% year over year, and they have risen in every single month over the past twelve. The slowest monthly gain was about $643; the fastest was $2,529 in late 2025.
Is it cheaper to rent or buy in Bismarck?
Renting is cheaper by roughly $980 a month at current rates. Average rent runs about $1,387, while owning the median home with 20% down works out to around $2,367 a month including taxes and insurance.
What is the most affordable neighborhood in Bismarck?
ZIP 58501 is the most affordable at $292,512, about 19% below the city median. Rent there averages $1,067, also the lowest in the city.
Methodology
Home values are based on the Zillow Home Value Index (ZHVI), a smoothed measure of typical home values in the 35th to 65th percentile range. Rent estimates use the Zillow Observed Rent Index (ZORI). Population figures come from the U.S. Census Bureau Population Estimates Program (2020-2024 vintage). All datasets are publicly available. Housing data updated 2026-02-28.