Alexandria Home Prices: $737K, Up 0.6% — 8 ZIPs Analyzed (2026)
$737K. That’s what a typical home costs in Alexandria, VA right now. Prices are up 0.6% from a year ago — barely enough to beat inflation. For a city just across the Potomac from the nation’s capital, though, that number masks a wide gap between neighborhoods. The cheapest ZIP sits under $450K. The most expensive tops $1 million.
Quick answer: The average home price in Alexandria, VA is $736,841 as of February 2026, up 0.6% year over year according to Zillow.
Current Home Prices in Alexandria
Alexandria sits in the Washington-Arlington-Alexandria metro area, one of the most expensive housing markets in the country. Here’s where things stand.
| Metric | Value |
|---|---|
| Median home value | $736,841 |
| Year-over-year change | +0.6% |
| Lowest ZIP median | $447,192 |
| Highest ZIP median | $1,047,002 |
| ZIPs tracked | 8 |
| Data as of | February 2026 |
That 0.6% annual gain translates to roughly $4,400 in equity over twelve months. Not exactly a windfall, but not a loss either. Alexandria’s market has been remarkably stable — the kind of flat growth that makes existing homeowners shrug and would-be buyers wonder if they should wait.
The $600K spread between the cheapest and most expensive neighborhoods tells you more than the median alone. Alexandria is not one market. It’s at least two: a sub-$500K market in the western corridors and a $800K-to-$1M+ market closer to Old Town and the waterfront.
For context, the national median home price hovers around $350K. Alexandria runs more than double that figure.
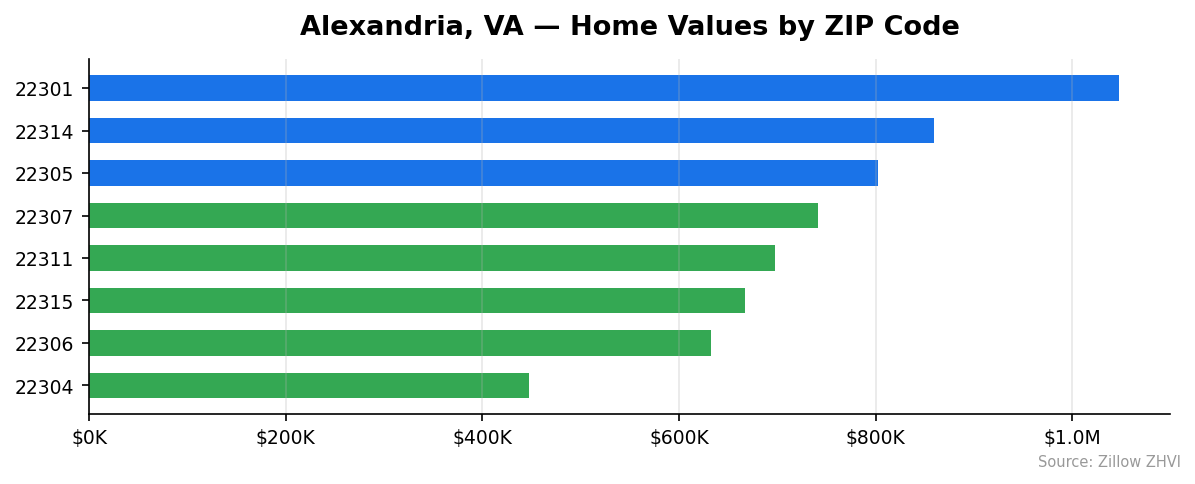
Alexandria Home Prices by Neighborhood
All eight tracked ZIP codes in Alexandria show meaningful price differences. Here’s the full breakdown.
| ZIP Code | Median Home Value | Monthly Rent |
|---|---|---|
| 22301 | $1,047,002 | $2,622 |
| 22314 | $859,523 | $2,544 |
| 22305 | $802,566 | $2,033 |
| 22307 | $741,239 | $2,925 |
| 22311 | $697,349 | $1,941 |
| 22315 | $666,877 | $2,564 |
| 22306 | $632,979 | $1,912 |
| 22304 | $447,192 | $2,030 |
Most Expensive ZIPs
22301 leads at $1,047,002 — the only ZIP in Alexandria to cross the million-dollar mark. This area covers the Del Ray and Rosemont neighborhoods north of Old Town and commands the highest rents at $2,622/month.
22314 comes in at $859,523, covering Old Town proper along the Potomac waterfront. Rent here averages $2,544/month.
22305 rounds out the top three at $802,566. Despite high home values, rents are a relative bargain at $2,033/month — one of the lower figures citywide.
Most Affordable ZIPs
22304 is Alexandria’s most affordable ZIP at $447,192 — nearly 40% below the city median. Rent runs $2,030/month, sitting mid-pack for the city.
22306 comes in at $632,979 with the lowest rents in the city at $1,912/month. Buyers and renters both get the best value here.
22315 at $666,877 offers a middle ground, though rents are surprisingly high at $2,564/month — the third highest in the city.
Rent vs Buy in Alexandria
The rent-versus-buy math in Alexandria skews heavily toward renting on a pure monthly-cost basis. Here’s a rough comparison using the city median.
| Metric | Rent | Buy |
|---|---|---|
| Monthly cost | ~$2,446 | ~$3,740 |
| Upfront cost | Security deposit | ~$147K (20% down) |
| Equity building | None | Yes |
The buy figure assumes a 30-year fixed mortgage at 6.5% on $589,473 (80% of $736,841). That $3,740 doesn’t include property taxes, insurance, or maintenance — which could push the real number past $4,500/month.
Rents vary widely across the city. ZIP 22306 offers the cheapest rents at $1,912/month. ZIP 22307 is the priciest at $2,925/month — a $1,013 gap.
One oddity: 22307 has the highest rents but only the fourth-highest home values. That mismatch could signal strong rental demand in that area. On the flip side, 22305 has the third-highest home values but below-average rents, which might favor buyers who plan to live there rather than invest.
If you’re purely optimizing for monthly cash flow, renting wins. If you’re staying five-plus years and want to build equity in a market that appreciates (even slowly), buying starts to make sense.
Population Growth and Migration
Alexandria’s population has been flat. The city had 159,144 residents in 2020 and 159,102 in 2024 — essentially unchanged over four years.
| Year | Population |
|---|---|
| 2020 | 159,144 |
| 2021 | 155,129 |
| 2022 | 155,235 |
| 2023 | 156,271 |
| 2024 | 159,102 |
The pandemic dip is visible. Alexandria lost about 4,000 residents between 2020 and 2021, likely driven by remote work enabling moves away from the D.C. metro. But the recovery has been steady — the city clawed back all of those losses by 2024.
Compared to other Virginia cities, Alexandria’s growth is tepid.
| City | 2024 Population | 4-Year Growth |
|---|---|---|
| Suffolk | 103,105 | +8.8% |
| Richmond | 233,655 | +3.0% |
| Chesapeake | 254,997 | +2.1% |
| Lynchburg | 80,301 | +1.7% |
| Hampton | 137,596 | +0.2% |
| Alexandria | 159,102 | 0.0% |
Suffolk grew nearly 9% in the same period. Richmond added 3%. Alexandria added zero.
Flat population means housing demand isn’t surging from new residents. The 0.6% price increase is likely driven by limited supply in a geographically constrained city, not by a flood of newcomers. Alexandria is essentially built out — there’s not much room for new single-family construction.
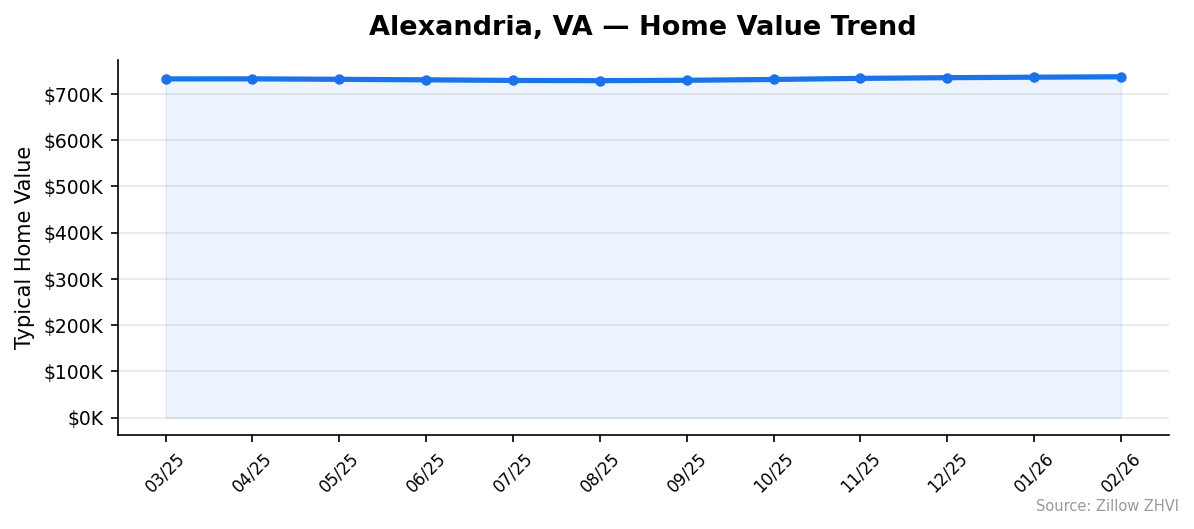
Alexandria Housing Market Trends
Here’s how Alexandria’s median home value moved month by month over the past year.
| Month | Median Value | Min ZIP | Max ZIP |
|---|---|---|---|
| Feb 2026 | $736,841 | $447,192 | $1,047,002 |
| Jan 2026 | $735,979 | $446,843 | $1,044,336 |
| Dec 2025 | $734,899 | $446,536 | $1,041,541 |
| Nov 2025 | $733,405 | $446,386 | $1,038,243 |
| Oct 2025 | $731,057 | $445,877 | $1,033,539 |
| Sep 2025 | $729,288 | $445,203 | $1,030,548 |
| Aug 2025 | $728,477 | $444,467 | $1,029,411 |
| Jul 2025 | $728,983 | $444,346 | $1,029,866 |
| Jun 2025 | $730,262 | $444,939 | $1,030,378 |
| May 2025 | $731,390 | $445,629 | $1,029,276 |
| Apr 2025 | $732,393 | $446,631 | $1,027,031 |
| Mar 2025 | $732,255 | $447,062 | $1,023,327 |
The pattern here is a shallow U-shape. Prices dipped slightly from spring 2025 through August 2025, bottoming at $728,477, then climbed steadily through winter into early 2026. The total swing from trough to current value: about $8,400, or just over 1%.
The most expensive ZIP (22301) tells a different story. It went from $1,023,327 in March 2025 to $1,047,002 in February 2026 — a $23,675 gain. The cheapest ZIP (22304) barely moved: $447,062 to $447,192, a gain of just $130.
Higher-priced neighborhoods are appreciating faster. The gap between Alexandria’s top and bottom is widening.
Is Alexandria a Good Place to Buy in 2026?
That depends on what you’re buying and why.
The numbers paint a picture of a stable, slow-growth market. A 0.6% annual gain won’t make anyone rich, but it won’t wipe out your down payment either. Alexandria hasn’t seen the wild swings that hit Sun Belt cities over the past few years.
For buyers: the flat population and modest appreciation mean you’re unlikely to face frenzied bidding wars. You’re also unlikely to see a bargain. This is a market that moves in inches.
For investors: the rent-to-price ratio is poor at the city level. You’d pay $737K to collect roughly $2,446/month in rent. That math doesn’t pencil unless you’re banking on long-term appreciation or buying in a high-rent ZIP like 22307.
For people who just want to live in Alexandria and plan to stay five or more years: the stability is actually the selling point. You’re buying into a market backed by federal employment, proximity to D.C., and finite land — all factors that put a floor under prices.
Alexandria Housing Market Outlook for 2026-2027
The six-month trend from August 2025 to February 2026 shows a steady climb of about $1,400/month. If that pace continues, Alexandria’s median could reach the $745K–$750K range by late 2026.
There’s no sign of acceleration. The gains are small and consistent — no month posted a jump greater than $2,400. This suggests the market is grinding upward on limited inventory rather than surging on demand.
The high end is moving faster. ZIP 22301 gained $17,500 in the last six months alone, while 22304 added less than $1,000. Expect this divergence to continue. Premium neighborhoods near Old Town and Del Ray have tighter supply and more affluent buyers.
Barring a major shift in mortgage rates or federal employment, Alexandria’s market looks set for another year of single-digit growth.
Similar Markets in VA
If you’re looking at Alexandria, these Virginia cities might also be on your radar:
- Arlington — Alexandria’s neighbor to the north with a similar D.C.-adjacent market and comparable price points.
- Fairfax — Further out in the suburbs but still within the D.C. metro. Prices tend to run lower.
- Woodbridge — A more affordable option south along I-95 for buyers priced out of Alexandria.
- Fredericksburg — About 50 miles south, offering significantly lower prices for those willing to commute.
- Virginia Beach — Different market entirely, but a popular alternative for buyers leaving the D.C. metro area.
Frequently Asked Questions
What is the average home price in Alexandria?
The average home price in Alexandria, VA is $736,841 as of February 2026. Prices across the city’s eight tracked ZIP codes range from $447,192 in ZIP 22304 to $1,047,002 in ZIP 22301.
Are home prices going up or down in Alexandria?
Prices are up 0.6% year over year. The market dipped slightly mid-2025, reaching a low of $728,477 in August, but has climbed steadily since then. The trend is upward, though gains are modest.
Is it cheaper to rent or buy in Alexandria?
Renting is cheaper on a monthly basis. The average rent across Alexandria is roughly $2,446/month, while a mortgage payment on the median home (20% down, 6.5% rate) runs about $3,740/month — before taxes and insurance. Buying costs roughly 53% more per month but builds equity.
What is the most affordable neighborhood in Alexandria?
ZIP code 22304 is the most affordable at $447,192 — about 39% below the city median. Rent in 22304 averages $2,030/month. The next most affordable is 22306 at $632,979, which also has the lowest rents in the city at $1,912/month.
Methodology
Home values are based on the Zillow Home Value Index (ZHVI), a smoothed measure of typical home values in the 35th to 65th percentile range. Rent estimates use the Zillow Observed Rent Index (ZORI). Population figures come from the U.S. Census Bureau Population Estimates Program (2020-2024 vintage). All datasets are publicly available. Housing data updated 2026-02-28.