Great Falls Home Prices: $326K, Up 4.3% — 3 ZIPs Analyzed (2026)
$326,225. That is what a typical home in Great Falls costs right now, and the price has gone up every single month for the past year. Year over year, values are up 4.3%.
Quick answer: The average home price in Great Falls, MT is $326,225 as of February 2026, up 4.3% year over year according to Zillow.
Current Home Prices in Great Falls
The Great Falls market is climbing slowly but steadily. Values range from $280,332 in the cheapest ZIP to $379,517 in the most expensive — a spread of roughly $99,000 between the city’s three measured areas.
| Metric | Value |
|---|---|
| Average home price | $326,225 |
| Year-over-year change | +4.3% |
| Lowest ZIP value | $280,332 |
| Highest ZIP value | $379,517 |
| Price spread | $99,185 |
| ZIP codes covered | 3 |
| Data through | February 2026 |
A 4.3% annual gain is not dramatic by national standards, but it is meaningful for a city with a shrinking population. Markets losing residents usually see flat or declining values. Great Falls is doing the opposite.
The gap between the cheap and expensive ZIPs is about 35%. That is a wider spread than you might expect for a small city, and it tells you neighborhoods carry very different price tags here. Where you buy matters more than the citywide average suggests.
Twelve months ago the typical home cost $312,902. Today it costs $326,225. That is a gain of $13,323 — roughly $1,100 per month in equity if you bought a year ago.
Great Falls Home Prices by Neighborhood
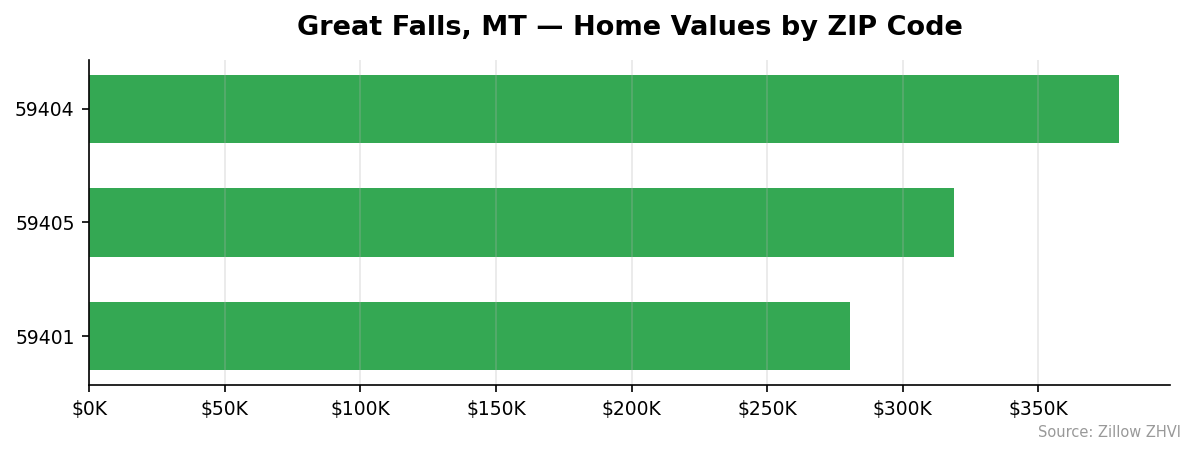
Three ZIPs cover the city, and the prices fan out by neighborhood character.
| ZIP | Median Value | Avg Rent | Premium vs City |
|---|---|---|---|
| 59404 | $379,517 | $1,813 | +16% |
| 59405 | $318,825 | $1,354 | -2% |
| 59401 | $280,332 | $1,152 | -14% |
Most Expensive
59404 tops the list at $379,517. Rents here also run highest at $1,813, suggesting newer or larger housing stock on the city’s outskirts.
Most Affordable
59401 is the cheapest at $280,332, with rents averaging $1,152 — the lowest in the city. This is the central Great Falls ZIP, typical of older urban cores where price points sit below the suburban edges.
59405 lands in the middle at $318,825 with $1,354 rent. It tracks just 2% below the citywide average, making it the most “average” neighborhood by the numbers.
Rent vs Buy in Great Falls
Renting wins on monthly cash flow. Buying wins on the long view.
The math at today’s prices:
| Cost | Buying ($326K, 20% down, 7%) | Renting (city avg) |
|---|---|---|
| Monthly payment | ~$1,740 P&I | |
| Taxes (est.) | ~$200 | |
| Insurance (est.) | ~$120 | |
| Total | ~$2,060 | ~$1,440 |
A buyer with 20% down on the median home faces roughly $2,060 a month before maintenance. Average rent across the three ZIPs comes to about $1,440. That is a $620 monthly gap in the renter’s favor.
But ZIP 59401 changes the picture. With a $280,332 median and $1,152 average rent, a 20% down buyer would pay around $1,790 — closer to a $640 premium over renting, but with a smaller upfront check ($56K down vs $65K citywide).
Renters keep their flexibility and their down payment cash. Buyers got a 4.3% return on their equity this year. At a $65,000 down payment, that is a paper gain of about $13,000 in 12 months — which roughly cancels out the rent-versus-buy gap if prices keep moving at this pace.
Population Growth and Migration
Great Falls is one of the few Montana cities losing people.
| Year | Population |
|---|---|
| 2020 | 60,453 |
| 2021 | 60,416 |
| 2022 | 60,464 |
| 2023 | 60,243 |
| 2024 | 60,013 |
The city lost 440 residents between 2020 and 2024 — a 0.7% decline. The bigger story is in the surrounding state.
| City | 2024 Population | 4-Year Growth |
|---|---|---|
| Billings | 121,483 | +3.6% |
| Missoula | 78,204 | +5.1% |
| Great Falls | 60,013 | -0.7% |
| Bozeman | 57,894 | +7.5% |
Bozeman, smaller than Great Falls, grew 7.5% over the same period and will likely pass it in population within a year or two at current trends. Missoula and Billings both expanded steadily.
For housing demand, this is a divergence worth watching. Prices are up 4.3% in a city that lost residents. That usually means either constrained supply, in-migration of higher-income buyers replacing lower-income renters, or simply the lag between population change and price response. Either way, the price trend and the population trend are pointing in opposite directions.
Great Falls Housing Market Trends
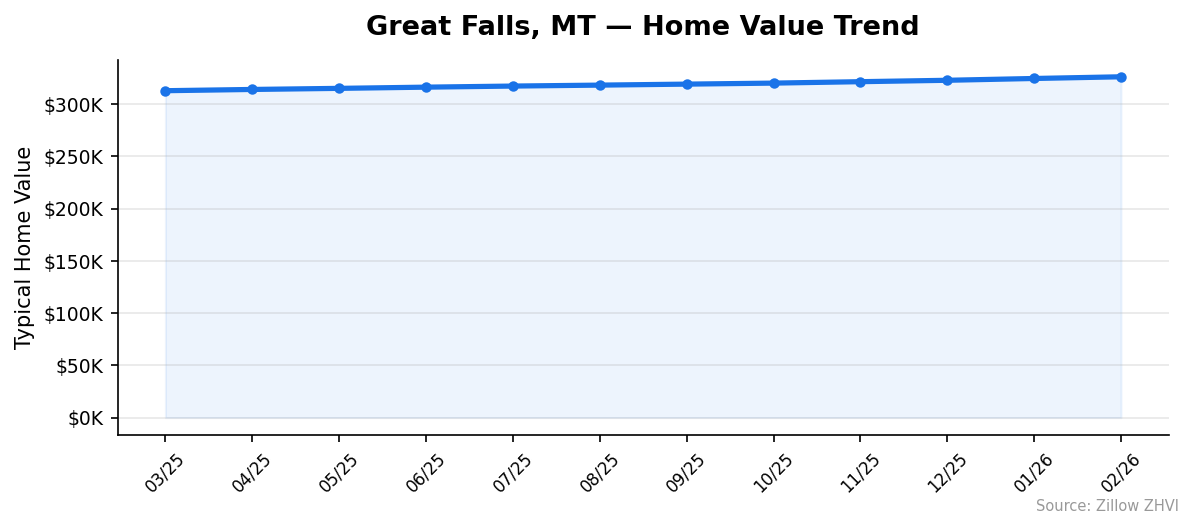
Twelve straight months of gains. No dips.
| Month | Avg Value | Change |
|---|---|---|
| Feb 2026 | $326,225 | +0.5% |
| Jan 2026 | $324,606 | +0.5% |
| Dec 2025 | $322,877 | +0.4% |
| Nov 2025 | $321,537 | +0.4% |
| Oct 2025 | $320,174 | +0.3% |
| Sep 2025 | $319,202 | +0.3% |
| Aug 2025 | $318,252 | +0.3% |
| Jul 2025 | $317,346 | +0.3% |
| Jun 2025 | $316,305 | +0.4% |
| May 2025 | $315,147 | +0.3% |
| Apr 2025 | $314,106 | +0.4% |
| Mar 2025 | $312,902 | — |
The monthly increases run between 0.3% and 0.5%. Nothing wild. But the consistency is the story.
Pace accelerated slightly in the last three months. Values rose $4,688 from November to February, versus $4,144 in the preceding three months. That is a small acceleration but a real one.
No month in the past year showed a decline. In markets that are cooling nationally, that kind of steady upward grind is unusual for a city with falling population.
Is Great Falls a Good Place to Buy in 2026?
Mixed signals. The price chart says buy. The population chart says wait.
What the data shows:
- Prices are climbing steadily, not spiking — lower risk of a bubble pop
- Affordability is good: $326K median is well below national figures
- ZIP 59401 offers entry points under $300K
- Rent yields are decent: $1,813 rent on a $380K home is roughly a 5.7% gross yield in 59404
What gives pause:
- Population fell 0.7% over four years while neighboring cities grew
- A shrinking population eventually catches up with price trends
- Limited ZIP coverage (just 3) means the price index reflects a narrow market
This looks like a buyer’s market on price but with caution flags on demand. If you plan to stay 5+ years and want to own rather than rent, the numbers work. If you are speculating on appreciation, the population trend is a yellow light.
Great Falls Housing Market Outlook for 2026-2027
If the current pace continues, Great Falls home values would cross $340,000 by late 2026. The three-month trend suggests monthly gains in the $1,500-$1,700 range.
But forecasting requires both sides of the equation. Price momentum is positive. Population momentum is negative. One of those will eventually bend the other.
The most likely 6-month path: continued modest gains in the 2-4% annualized range, with possible flattening if buyer demand softens further. The 12-month picture depends on whether out-migration accelerates or stabilizes.
Watch the monthly change column. If it drops below 0.2% for two consecutive months, the trend is breaking. So far there is no sign of that.
Similar Markets in MT
- Billings — Montana’s largest city, growing while Great Falls shrinks, worth comparing for buyers prioritizing demand fundamentals.
- Missoula — university town with 5.1% population growth, typically priced higher than Great Falls.
- Proctor — small Montana market for buyers looking outside the main urban centers.
Frequently Asked Questions
What is the average home price in Great Falls?
The average home price in Great Falls, MT is $326,225 as of February 2026. That is the Zillow Home Value Index figure averaged across the three ZIPs covering the city. Individual ZIP values range from $280,332 to $379,517.
Are home prices going up or down in Great Falls?
Up. Values rose 4.3% year over year and increased in every single month over the past 12 months. The pace has been steady — roughly 0.3% to 0.5% per month — with a slight acceleration in the most recent quarter.
Is it cheaper to rent or buy in Great Falls?
Renting is cheaper on a monthly basis. The average rent across the three ZIPs is about $1,440, while owning the median $326K home would run roughly $2,060 a month including taxes and insurance (assuming 20% down at current rates). Buyers come out ahead long-term if prices keep gaining 4% annually.
What is the most affordable neighborhood in Great Falls?
ZIP 59401 at $280,332. That is about $46,000 below the citywide average and represents central Great Falls. Rent there averages $1,152 — the lowest in the city.
Methodology
Home values are based on the Zillow Home Value Index (ZHVI), a smoothed measure of typical home values in the 35th to 65th percentile range. Rent estimates use the Zillow Observed Rent Index (ZORI). Population figures come from the U.S. Census Bureau Population Estimates Program (2020-2024 vintage). All datasets are publicly available. Housing data updated 2026-02-28.