Ocala Home Prices: $272K, Down 3.2% — 11 ZIPs Analyzed (2026)
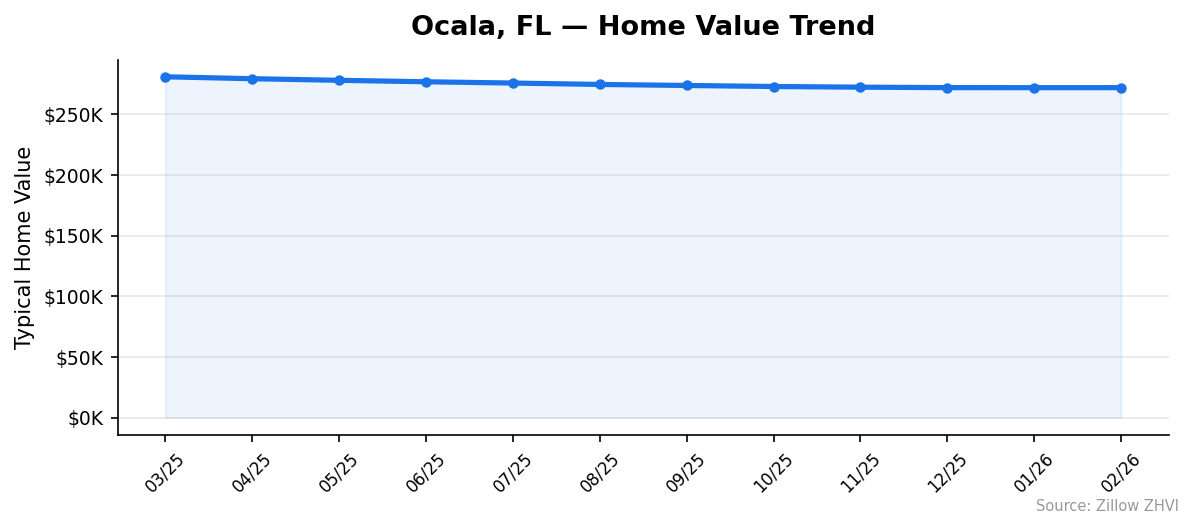
$272,034. That’s the typical home value in Ocala right now, and it’s lower than it was a year ago. Prices have slipped 3.2% over the past 12 months, with the decline stretching across every month of the trend data.
Quick answer: The average home price in Ocala, FL is $272,034 as of February 2026, down 3.2% year over year according to Zillow.
Current Home Prices in Ocala
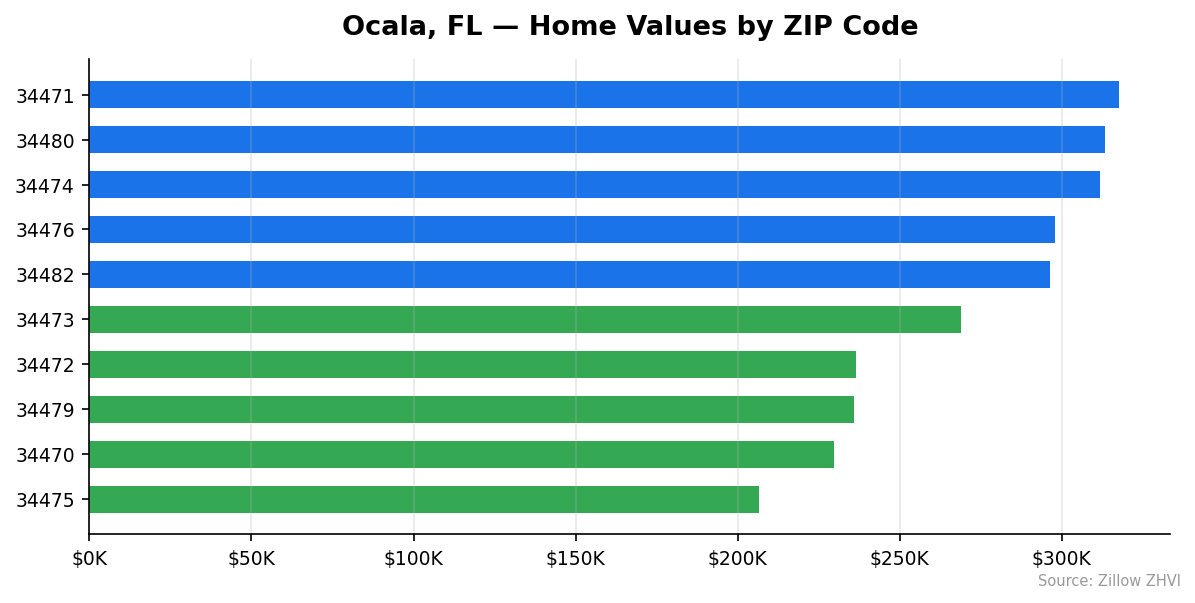
The typical Ocala home costs $272,034. Values range from $206,527 in the cheapest ZIP to $317,582 in the most expensive — a spread of about $111,000 between the bottom and top of the local market.
| Metric | Value |
|---|---|
| Median home value | $272,034 |
| Year-over-year change | -3.2% |
| Lowest ZIP median | $206,527 |
| Highest ZIP median | $317,582 |
| Price spread | $111,055 |
| ZIP codes analyzed | 11 |
| Data through | February 2026 |
The 3.2% drop is meaningful but not severe. On a $272K home, that translates to roughly $9,000 in lost paper value over a year. Sellers who bought near the peak in spring 2025 — when the typical home cost $280,990 — are now sitting on homes worth about $9,000 less.
The decline has been steady rather than sharp. Every month since March 2025 has posted a small drop from the previous month. There’s no single cliff in the data, just a slow grind lower.
For you as a buyer, this matters more than the headline number suggests. Steady price decline means less competition, more negotiating room, and homes that linger long enough to inspect carefully. For sellers, it means pricing realistically and not anchoring to what neighbors got 18 months ago.
Ocala Home Prices by Neighborhood
Eleven ZIP codes make up the Ocala market in this dataset. The gap between the most and least expensive is wide enough that you’re effectively shopping in two different markets.
| ZIP Code | Median Home Value | Median Rent |
|---|---|---|
| 34471 | $317,582 | $1,593 |
| 34480 | $313,229 | $1,420 |
| 34474 | $311,657 | $1,586 |
| 34476 | $297,937 | $1,835 |
| 34482 | $296,203 | $1,826 |
| 34481 | $278,142 | $1,580 |
| 34473 | $268,917 | $1,743 |
| 34472 | $236,414 | $1,636 |
| 34479 | $235,948 | $1,438 |
| 34470 | $229,815 | $1,401 |
| 34475 | $206,527 | $1,441 |
Most Expensive
34471 tops the list at $317,582, about 17% above the citywide median. 34480 follows at $313,229, with rents that lag the price tier — suggesting it skews owner-occupied. 34474 rounds out the top three at $311,657.
Most Affordable
34475 is the cheapest entry point at $206,527 — about $65,000 below the city median. 34470 comes in at $229,815, paired with the lowest rent in the city ($1,401). 34479 lands at $235,948 with similarly low rents, making these three ZIPs the working budget for buyers under $250K.
Rent vs Buy in Ocala
Rents in Ocala run from $1,401 in 34470 to $1,835 in 34476. The citywide average lands around $1,590 a month.
Compare that to a mortgage. A $272,034 home with 10% down at 7% interest runs roughly $1,629 in principal and interest, before property taxes, insurance, and HOA fees. Add Florida’s homeowners insurance — which has been climbing — and total monthly ownership cost easily hits $2,200 to $2,500.
| Cost Type | Monthly |
|---|---|
| Typical rent (citywide avg) | ~$1,590 |
| P&I on median home (10% down, 7%) | ~$1,629 |
| Estimated total ownership cost | $2,200-$2,500 |
That’s a $600 to $900 monthly gap favoring renters at current rates. The math only flips if you can put down 20% or more, get a rate below 6%, or plan to hold the home long enough for appreciation to offset the carrying cost difference.
With prices declining 3.2% over the past year, the case for waiting is stronger than usual. A buyer who rents for 12 more months while prices keep drifting lower captures both the savings and a lower entry price — assuming the trend holds.
Population Growth and Migration
Ocala grew. The city added 6,366 residents between 2020 and 2024, reaching 70,251 people — a 10% gain over four years.
| Year | Population |
|---|---|
| 2020 | 63,885 |
| 2021 | 64,392 |
| 2022 | 65,655 |
| 2023 | 68,829 |
| 2024 | 70,251 |
The growth wasn’t smooth. The 2022-to-2023 jump alone added 3,174 people, more than any other single-year gain. That kind of surge typically leaves housing markets digesting inventory for a year or two afterward — which fits the current price softness.
Stacked against other Florida cities, Ocala’s 10% growth is solid but not the leader.
| City | 2024 Population | 4-Year Growth |
|---|---|---|
| Port St. Lucie | 258,575 | 25.0% |
| Cape Coral | 233,025 | 19.2% |
| Miami | 487,014 | 10.0% |
| Ocala | 70,251 | 10.0% |
| Orlando | 334,854 | 8.8% |
| Tampa | 414,547 | 6.7% |
Ocala is keeping pace with Miami’s growth rate at a fraction of Miami’s price point. That’s the underlying demand story even as prices soften — more people kept arriving, but the housing market overshot on price during the run-up and is now correcting.
Ocala Housing Market Trends
The trend table tells a consistent story. Every month for the past year posted a small step down.
| Month | Median Value |
|---|---|
| Feb 2026 | $272,034 |
| Jan 2026 | $272,022 |
| Dec 2025 | $272,058 |
| Nov 2025 | $272,430 |
| Oct 2025 | $272,979 |
| Sep 2025 | $273,829 |
| Aug 2025 | $274,677 |
| Jul 2025 | $275,829 |
| Jun 2025 | $276,882 |
| May 2025 | $278,085 |
| Apr 2025 | $279,406 |
| Mar 2025 | $280,990 |
From March 2025 to February 2026, the median fell from $280,990 to $272,034 — a drop of $8,956 over 11 months. That’s roughly $815 per month in lost typical value.
The pace has slowed lately. The drop from January to February 2026 was just $-12 — essentially flat. October-to-November saw a $549 drop. Compare that to May-to-June 2025, when the median fell $1,203 in a single month. The bleeding hasn’t stopped, but it’s slowing.
That deceleration is the most useful signal in the data. Markets that decline at a slowing pace are often a few months from finding a floor.
Is Ocala a Good Place to Buy in 2026?
The data points to a buyer’s market — but a soft one, not a fire sale.
Prices are down 3.2% year over year. Inventory is presumably loose enough that sellers can’t hold the line on prices. Renting beats buying on monthly cash flow by several hundred dollars. Population growth supports long-term demand, but it hasn’t been strong enough to clear the supply that pushed prices to their March 2025 peak.
If you’re buying to live in Ocala for 5+ years, the math works. You’re entering at a price about 3% below last year’s level, with sellers more flexible than they’ve been in years. The most affordable ZIPs — 34475, 34470, 34479 — give you entry points under $240K.
If you’re buying as a short-term investment, the picture is harder. Rents don’t cover ownership costs on a typical purchase at current rates. You’d need either cash-heavy buyers or an unusually cheap ZIP-rent combination to make the numbers work.
Ocala Housing Market Outlook for 2026-2027
The 3-month trend shows the decline slowing meaningfully. December to February saw the median move by only $24 total — close to flat. The 6-month change is steeper, with prices down about $1,800 since September.
If the current pace continues, prices would drift slightly lower through mid-2026 before potentially stabilizing. The deceleration visible in the monthly data is the strongest signal here — a market that’s been falling for nearly a year is showing its first real signs of finding a base.
Two things could change that. A renewed surge in population growth would tighten supply and push prices back up. A spike in insurance costs or mortgage rates would deepen the correction. Neither is in the dataset.
For a buyer, the practical read is that waiting longer than 3-6 months probably yields diminishing returns. The big drops are behind, and you’re now negotiating against a floor more than chasing it down.
Similar Markets in FL
If Ocala’s price point appeals but you want options:
- Jacksonville — larger metro, similar mid-tier pricing, more job market depth.
- Tampa — bigger price tag than Ocala but stronger rental yields.
- Orlando — central Florida alternative with more inventory and similar growth.
- Port Saint Lucie — the state’s fastest-growing city in this comparison set, at 25% over four years.
- Homestead — south Florida entry point for buyers priced out of Miami proper.
Frequently Asked Questions
What is the average home price in Ocala?
The average home value in Ocala is $272,034 as of February 2026. That’s the citywide median across 11 ZIP codes, ranging from $206,527 in the most affordable ZIP to $317,582 in the priciest.
Are home prices going up or down in Ocala?
Down. Ocala home values fell 3.2% over the 12 months ending February 2026, with the median dropping from about $280,990 in March 2025 to $272,034. The pace of decline has slowed in recent months, suggesting the market may be nearing a floor.
Is it cheaper to rent or buy in Ocala?
Renting is cheaper monthly. Typical rents run $1,401 to $1,835 across Ocala ZIPs, while estimated total ownership costs on a $272K home — including mortgage, insurance, and taxes — run $2,200 to $2,500 a month at current rates. Buying makes sense if you plan to hold 5+ years.
What is the most affordable neighborhood in Ocala?
ZIP 34475 is the cheapest at $206,527 — about 24% below the city median. ZIPs 34470 ($229,815) and 34479 ($235,948) round out the three most affordable areas, all sitting well under the $250K mark.
Methodology
Home values are based on the Zillow Home Value Index (ZHVI), a smoothed measure of typical home values in the 35th to 65th percentile range. Rent estimates use the Zillow Observed Rent Index (ZORI). Population figures come from the U.S. Census Bureau Population Estimates Program (2020-2024 vintage). All datasets are publicly available. Housing data updated 2026-02-28.