Boulder Home Prices: $955K, Down 1.9% — 5 ZIPs Analyzed (2026)
$955,365. That’s what a typical home costs in Boulder as of February 2026, and it’s $18,788 less than a year ago. Prices have slipped 1.9% over twelve months, the kind of pullback that hasn’t shown up in this market in years.
Quick answer: The average home price in Boulder, CO is $955,365 as of February 2026, down 1.9% year over year according to Zillow.
Current Home Prices in Boulder
The typical Boulder home is worth nearly $1 million. Across the five ZIP codes covered here, values range from $706,786 in the cheapest tier to $1,201,043 at the top end. That spread — about $494,000 — tells you most of what you need to know about how location-dependent this market is.
| Metric | Value |
|---|---|
| Median home value | $955,365 |
| Year-over-year change | -1.9% |
| Cheapest ZIP | $706,786 |
| Most expensive ZIP | $1,201,043 |
| ZIP codes tracked | 5 |
| Data through | February 2026 |
Year over year, the city is in mild correction. Twelve months ago the typical home was worth about $974,153. The decline isn’t dramatic — it works out to roughly $1,500 a month off the median — but the direction has been consistent.
What’s interesting is the floor. Even at the bottom of the local market, $706,786 buys you a typical home. That’s more than double the national median. Boulder remains one of the priciest mid-size cities in the Mountain West, even after a year of softening.
The half-million-dollar gap between the cheapest and most expensive ZIP is wider than the entire median home price in many Midwestern cities. If you’re shopping here, the ZIP code you choose matters more than almost any other decision.
Boulder Home Prices by Neighborhood
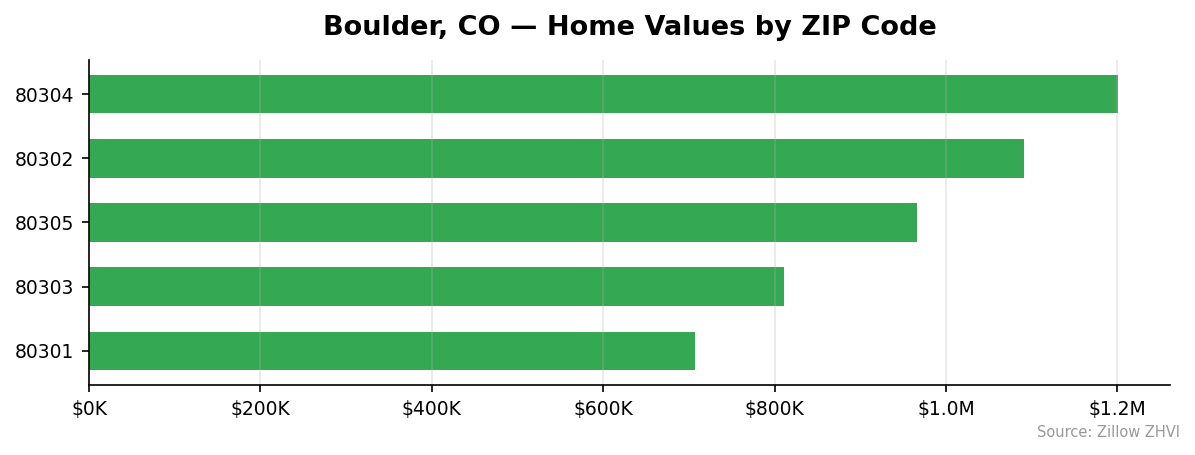
Five ZIP codes cover the city. Two sit above $1 million, two cluster in the $800K–$970K range, and one comes in just over $700K.
| ZIP Code | Typical Home Value | Median Rent | Rent-to-Price Ratio |
|---|---|---|---|
| 80304 | $1,201,043 | $2,474 | 0.21% |
| 80302 | $1,091,557 | $2,903 | 0.27% |
| 80305 | $966,259 | $3,694 | 0.38% |
| 80303 | $811,183 | $2,446 | 0.30% |
| 80301 | $706,786 | $2,188 | 0.31% |
Most Expensive
80304 — $1,201,043. The priciest ZIP in the city, running about 26% above the Boulder median. Rents are mid-pack at $2,474, which makes its rent-to-price ratio the weakest in town.
80302 — $1,091,557. Sits 14% above the city median. The $2,903 rent is the second highest tracked here.
80305 — $966,259. Roughly at the city median for prices but pulls in the highest rent in Boulder at $3,694 — about 51% more than what 80301 rents collect.
Most Affordable
80301 — $706,786. The cheapest entry point in Boulder, 26% below the city median. Rents are also the lowest here at $2,188.
80303 — $811,183. Sits 15% below the city average with $2,446 rents — the best balance of price and rent income among the lower-priced ZIPs.
80305 — $966,259. Mid-tier on prices, but the rent number changes the math significantly compared to the higher-value ZIPs.
Rent vs Buy in Boulder
Renting wins, and it’s not close.
Average rent across the five Boulder ZIPs is about $2,741 a month. Compare that to a mortgage on the typical $955,365 home. Put 20% down ($191,073), finance the remaining $764,292 at a 7% 30-year rate, and the principal-and-interest payment alone runs about $5,084. Add property taxes (Colorado averages roughly 0.5% of value, or $398 a month) and homeowner’s insurance (~$150). You’re looking at $5,632 a month before maintenance.
| Monthly Cost | |
|---|---|
| Average rent (5 ZIPs) | $2,741 |
| Estimated mortgage (20% down, 7%) | $5,084 |
| Property tax + insurance | ~$548 |
| Total owner cost | ~$5,632 |
That’s roughly $2,891 more per month to own than to rent — about $34,700 a year before any maintenance or HOA fees.
The gap varies by ZIP. In 80305, where rent runs $3,694, the spread narrows but ownership still costs nearly $2,000 more. In 80304, where homes top $1.2 million and rent is $2,474, the buy-vs-rent gap balloons past $4,000 a month.
Rent-to-price ratios in Boulder fall between 0.21% and 0.38%, well below the 1% benchmark investors typically look for. The math favors renters — at least until prices fall further or rents catch up.
Population Growth and Migration
Boulder is shrinking. The population stood at 108,418 in 2020 and dropped to 106,803 by 2024, a 1.5% decline over four years.
| Year | Population |
|---|---|
| 2020 | 108,418 |
| 2021 | 104,316 |
| 2022 | 106,079 |
| 2023 | 106,634 |
| 2024 | 106,803 |
The 2021 dip was steep — more than 4,000 residents gone in a single year. Numbers have recovered some ground since, but the city still hasn’t returned to its 2020 baseline.
Meanwhile, nearby Colorado cities are pulling ahead:
| City | Population (2024) | 4-Year Growth |
|---|---|---|
| Greeley | 114,363 | +4.6% |
| Aurora | 403,130 | +4.2% |
| Thornton | 146,689 | +3.2% |
| Colorado Springs | 493,554 | +2.5% |
| Denver | 729,019 | +1.6% |
| Boulder | 106,803 | -1.5% |
Every comparable Colorado city in the data added residents while Boulder lost them. Greeley grew 4.6% over the same span Boulder fell 1.5% — a six-point gap that shows up in housing demand differently than the headline price suggests.
A shrinking population is usually a headwind for home prices. The fact that values held above $940K even through the recent dip points to constrained supply doing the heavy lifting. Boulder has limited buildable land and tight zoning, which has historically kept prices firm even when buyer demand softens.
Boulder Housing Market Trends
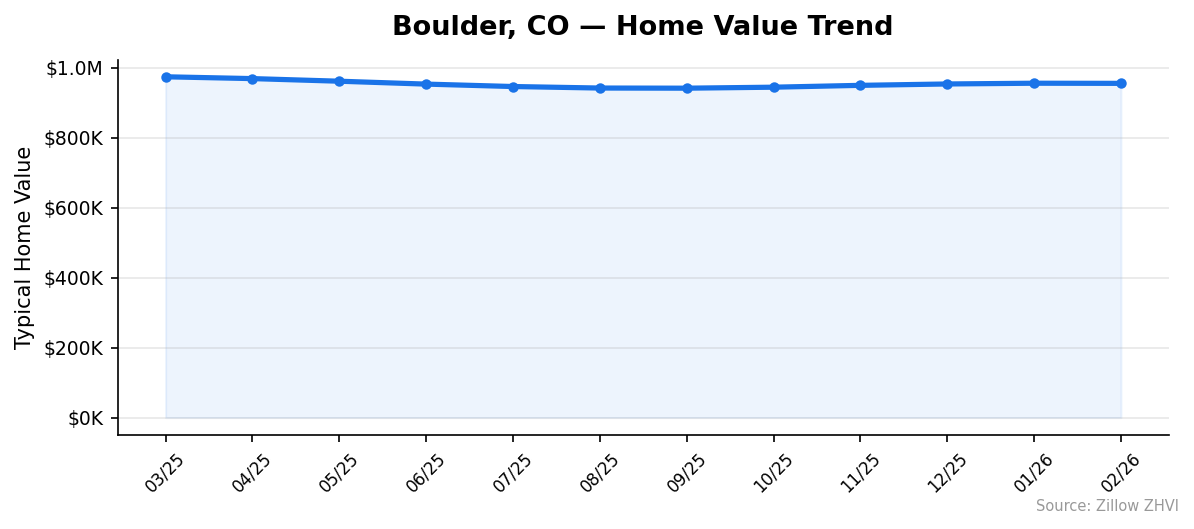
The 12-month picture: prices fell, then bottomed, then partly recovered.
| Month | Typical Value |
|---|---|
| March 2025 | $974,153 |
| April 2025 | $968,972 |
| May 2025 | $961,513 |
| June 2025 | $953,233 |
| July 2025 | $946,320 |
| August 2025 | $941,984 |
| September 2025 | $941,582 |
| October 2025 | $944,411 |
| November 2025 | $949,685 |
| December 2025 | $953,628 |
| January 2026 | $955,760 |
| February 2026 | $955,365 |
The peak was March 2025 at $974,153. From there, six straight months of declines took the typical home down to $941,582 in September — a drop of $32,571.
Then the floor held. October through January posted four consecutive monthly gains, adding roughly $14,178 back. February barely moved at all, slipping $395 from January.
That flattening matters. The market isn’t bouncing back hard, but it’s not falling either. The recovery from September lows has slowed each month: October added $2,829, November $5,274, December $3,943, January $2,132, and February went slightly negative.
This looks like a market searching for a level rather than one heading anywhere in particular.
Is Boulder a Good Place to Buy in 2026?
The data points to a buyer-friendly market with caveats.
Prices are down 1.9% year over year. Population is contracting. The rent-to-price ratio across all five ZIPs sits well below 1%, meaning owning costs far more per month than renting an equivalent home. None of these are seller’s-market indicators.
But Boulder doesn’t behave like other cities. Supply is structurally tight — geography and zoning limit new construction — so even with shrinking population, prices haven’t collapsed. The $30K-plus drop from March to September 2025 was the steepest stretch in recent memory, and the market still found a floor above $940K.
If you need to live here, the buy-vs-rent math says rent. The roughly $2,900 monthly premium to own a typical home doesn’t pencil out unless you plan to stay long enough to ride out the current correction and capture appreciation.
If you’re an investor, the rent ratios are weak. ZIP 80305 has the best income profile at 0.38%, but even that lags most cash-flow markets nationally.
If you’re a buyer who values Boulder specifically, the past 12 months gave you the best entry point in years.
Boulder Housing Market Outlook for 2026-2027
The 3-month trend suggests prices have flattened near $955K. December through February moved a combined $1,737 — essentially noise.
If the current pace continues, expect Boulder to trade in a narrow range through mid-2026. The recovery off September lows has decelerated each month, and February’s small dip could mark the end of the rebound. A return to the March 2025 peak of $974,153 would require sustained monthly gains of $3,000-plus, which the recent data doesn’t show.
The bigger uncertainty is population. Boulder has shed residents since 2020 while neighbors gained. If that pattern persists, demand pressure stays soft. If it reverses, the city’s tight supply could push prices back toward last year’s highs.
Watch the next two prints. If March and April come in flat or negative, the rebound is over and prices likely drift sideways or down through summer. If they bounce, the floor from September is holding.
Similar Markets in CO
- Longmont — A close neighbor in the same metro area, often the next stop for buyers priced out of Boulder.
- Fort Collins — Another college town along the Front Range with a similar demographic profile but typically lower prices.
- Denver — The state’s largest market, useful for benchmarking Boulder’s premium against the metro core.
- Aurora — Growing faster than Boulder and considerably cheaper, attractive for value-focused Colorado buyers.
- Centennial — A south Denver suburb that competes for the same kind of buyer who might consider Boulder.
Frequently Asked Questions
What is the average home price in Boulder?
The average home price in Boulder, CO is $955,365 as of February 2026. That figure comes from the Zillow Home Value Index averaged across the five ZIP codes that make up the city. Values within Boulder range from $706,786 in ZIP 80301 to $1,201,043 in ZIP 80304.
Are home prices going up or down in Boulder?
Down. Boulder home prices fell 1.9% over the past 12 months, dropping from a March 2025 peak of $974,153 to $955,365 in February 2026. The market hit a low of $941,582 in September 2025 and has partly recovered since, though gains have slowed each month.
Is it cheaper to rent or buy in Boulder?
Renting is significantly cheaper. The average ZIP-level rent is about $2,741 a month, while a mortgage on a typical $955,365 home with 20% down at 7% interest runs around $5,632 a month including taxes and insurance — roughly $2,891 more per month than renting.
What is the most affordable neighborhood in Boulder?
ZIP 80301 is the cheapest, with a typical home value of $706,786 — about 26% below the citywide median. Rents are also the lowest there at $2,188 a month. The next most affordable option is 80303 at $811,183.
Methodology
Home values are based on the Zillow Home Value Index (ZHVI), a smoothed measure of typical home values in the 35th to 65th percentile range. Rent estimates use the Zillow Observed Rent Index (ZORI). Population figures come from the U.S. Census Bureau Population Estimates Program (2020-2024 vintage). All datasets are publicly available. Housing data updated 2026-02-28.