Billings Home Prices: $409K, Up 0.7% — 4 ZIPs Analyzed (2026)
$409,371. That’s what a typical home costs in Billings right now. Prices inched up 0.7% over the past year — not a surge, not a slide. For Montana’s largest city, that kind of stability is worth a closer look.
Quick answer: The average home price in Billings, MT is $409,371 as of February 2026, up 0.7% year over year according to Zillow.
Current Home Prices in Billings
Here’s a snapshot of where the Billings housing market stands right now.
| Metric | Value |
|---|---|
| Median Home Price | $409,371 |
| Year-over-Year Change | +0.7% |
| Lowest ZIP Median | $322,037 |
| Highest ZIP Median | $534,768 |
| ZIP Codes Tracked | 4 |
| Data as of | February 2026 |
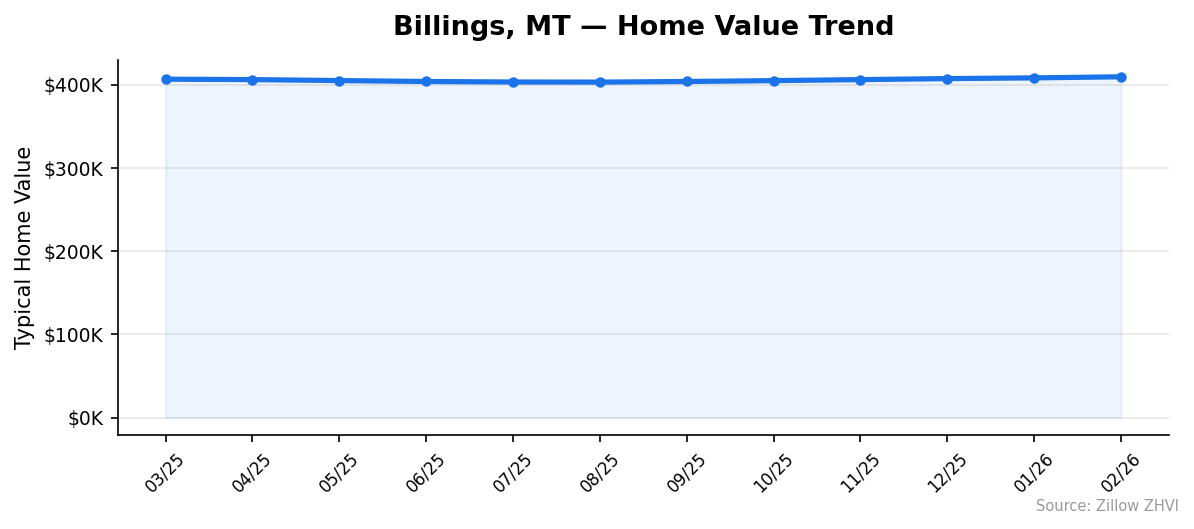
A 0.7% gain over twelve months is barely above flat. For context, the median sat at $406,511 in March 2025 and dipped to $402,967 by August before reversing course. The market spent most of 2025 in a holding pattern before finding some late-year momentum.
The spread between the cheapest and most expensive ZIP codes is $212,731. That’s a wide gap for a mid-sized city, and it means your buying experience in Billings depends heavily on which side of town you’re looking at.
Billings Home Prices by Neighborhood
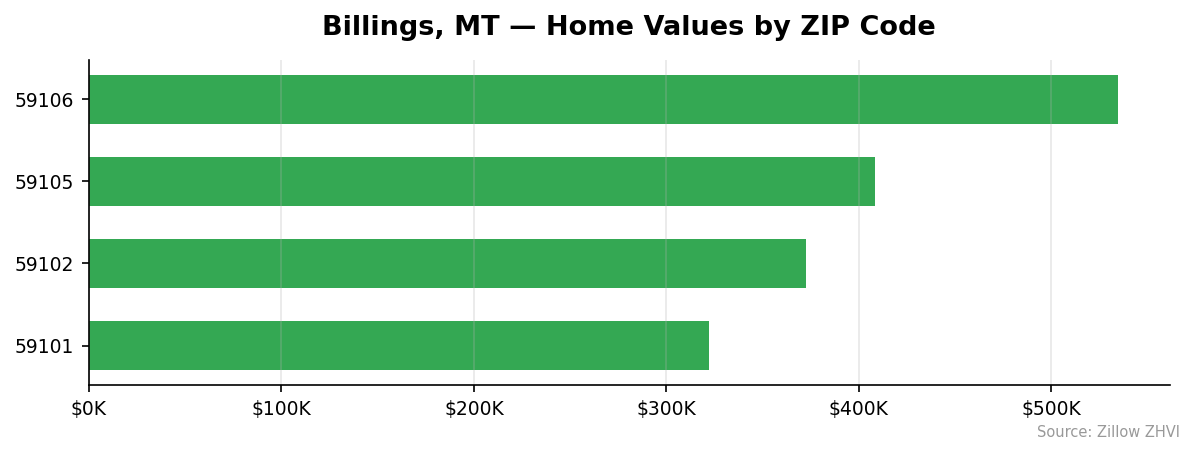
All four tracked ZIP codes in Billings show meaningful price differences.
| ZIP Code | Median Home Value | Avg Monthly Rent |
|---|---|---|
| 59101 | $322,037 | $1,186 |
| 59102 | $372,379 | $1,439 |
| 59105 | $408,299 | $1,231 |
| 59106 | $534,768 | $1,552 |
Most Expensive
59106 tops the list at $534,768 — 30.6% above the city median, with rents to match at $1,552/month. This is Billings’ premium market.
Most Affordable
59101 is the entry point at $322,037, a full 21.3% below the city median. Rents here are the lowest too, at $1,186/month. If you’re looking for the most accessible way into the Billings market, this ZIP is it.
59102 sits at $372,379, still about 9% below the citywide median. Interestingly, rents in 59102 run $1,439 — higher than in 59105 despite lower home values. That gap suggests rental demand may be shifting in this part of town.
Rent vs Buy in Billings
The rent-versus-buy math in Billings leans heavily toward renting right now, at least on a pure monthly-cost basis.
| ZIP Code | Monthly Rent | Est. Mortgage Payment* | Difference |
|---|---|---|---|
| 59101 | $1,186 | ~$1,890 | +$704 |
| 59102 | $1,439 | ~$2,185 | +$746 |
| 59105 | $1,231 | ~$2,395 | +$1,164 |
| 59106 | $1,552 | ~$3,140 | +$1,588 |
*Estimated at 6.5% rate, 30-year fixed, 20% down payment. Does not include taxes, insurance, or maintenance.
Across every ZIP code, buying costs more per month than renting. The gap is smallest in 59101, where the mortgage premium is about $704. In 59106, you’d pay roughly double the rent to own.
That said, mortgage payments build equity. Renting doesn’t. With prices rising only 0.7% annually, the appreciation argument is thin right now — but it’s still positive.
The citywide average rent sits around $1,352/month across the four tracked ZIPs. For a household weighing the decision, the break-even timeline on buying depends on how long you plan to stay. At sub-1% annual appreciation, you’d need several years for equity gains to offset the monthly premium.
Population Growth and Migration
Billings keeps getting bigger. The metro area’s population hit 121,483 in 2024, up 3.6% from 117,233 in 2020.
| Year | Population | Change |
|---|---|---|
| 2020 | 117,233 | — |
| 2021 | 117,763 | +530 |
| 2022 | 119,952 | +2,189 |
| 2023 | 120,797 | +845 |
| 2024 | 121,483 | +686 |
Growth peaked in 2022 with nearly 2,200 new residents, then slowed to a steadier pace. The city is still gaining people, just not at the same clip.
How does Billings stack up against other Montana metros?
| City | 2024 Population | 4-Year Growth |
|---|---|---|
| Billings | 121,483 | +3.6% |
| Missoula | 78,204 | +5.1% |
| Great Falls | 60,013 | -0.7% |
| Bozeman | 57,894 | +7.5% |
Bozeman is growing the fastest at 7.5%, but from a much smaller base. Billings added more total residents than Bozeman over the same period. Great Falls is the outlier — it’s actually losing people.
Steady population growth supports housing demand. More residents means more buyers and renters competing for the same housing stock, which puts a floor under prices even when appreciation is modest.
Billings Housing Market Trends
Here’s how the median home value moved month by month over the past year.
| Month | Median Value | Change from Prior Month |
|---|---|---|
| March 2025 | $406,511 | — |
| April 2025 | $405,991 | -$520 |
| May 2025 | $404,837 | -$1,154 |
| June 2025 | $403,726 | -$1,111 |
| July 2025 | $403,097 | -$629 |
| August 2025 | $402,967 | -$130 |
| September 2025 | $403,713 | +$746 |
| October 2025 | $404,757 | +$1,044 |
| November 2025 | $405,991 | +$1,234 |
| December 2025 | $407,204 | +$1,213 |
| January 2026 | $408,058 | +$854 |
| February 2026 | $409,371 | +$1,313 |
The trend tells a clear story in two acts. Prices declined from March through August 2025, losing about $3,500 in total. Then the market turned. From September 2025 through February 2026, values climbed every single month, recovering all the lost ground and then some.
August 2025 was the bottom at $402,967. Since then, the market has added $6,404 — a gain of 1.6% in six months.
The monthly increases have been remarkably consistent, hovering between $750 and $1,300. No wild swings, no stalling out. That kind of steady grind upward suggests real demand, not speculation.
Is Billings a Good Place to Buy in 2026?
The data paints a picture of a stable, mildly appreciating market. That can be good or bad depending on what you’re after.
For homebuyers looking to live here: Billings offers a range of price points. You can get into 59101 for $322K or pay up for 59106 at $535K. Prices are rising, but slowly. You’re unlikely to get priced out next month, and you’re unlikely to see a major correction either.
For investors: A 0.7% annual appreciation rate won’t excite anyone chasing capital gains. But rents are steady, and the population is growing. The rent-to-price ratio in 59101 (around 4.4% gross yield) is the strongest in the city.
The risk: Billings’ recovery is only six months old. If national mortgage rates spike or Montana’s job market softens, that momentum could stall.
This is not a market where you need to rush. It rewards patience and careful ZIP-code selection.
Billings Housing Market Outlook for 2026-2027
Six straight months of gains point upward. If the current pace of roughly $1,000-$1,300 per month continues, Billings could breach $415,000 by mid-2026.
The 3-month trend from December through February shows consistent gains averaging about $1,084/month. That pace, if sustained through summer — historically a stronger buying season — could push values higher.
The market spent the first half of 2025 cooling off and the second half recovering. That U-shape suggests Billings found a price floor around $403K. As long as population growth continues and inventory stays moderate, prices should hold or grind higher.
Don’t expect fireworks. This is a single-digit appreciation market. But the trend has clearly shifted from declining to rising, and there’s no sign of that reversing yet.
Similar Markets in MT
If you’re considering Billings, these other Montana markets are worth comparing:
- Great Falls — Montana’s third-largest city, and the only one in the state losing population. Likely offers lower prices for buyers willing to accept a shrinking market.
- Missoula — Growing at 5.1% and home to the University of Montana. Expect higher prices but stronger long-term demand.
- Proctor — A smaller Montana community for buyers looking beyond the major metros.
Frequently Asked Questions
What is the average home price in Billings?
The average home price in Billings is $409,371 as of February 2026. That number reflects the citywide median across four tracked ZIP codes, where values range from $322,037 in 59101 to $534,768 in 59106.
Are home prices going up or down in Billings?
Prices are going up. The year-over-year change is +0.7%. After dipping through the first half of 2025, values bottomed out in August at $402,967 and have climbed every month since. The six-month gain from the bottom is 1.6%.
Is it cheaper to rent or buy in Billings?
Renting is cheaper on a monthly basis across every ZIP code in Billings. The average rent is roughly $1,352/month, while mortgage payments on the median home would run around $2,400/month assuming 20% down and a 6.5% rate. The gap narrows in the most affordable ZIP (59101), where rent runs $1,186 versus an estimated $1,890 mortgage payment.
What is the most affordable neighborhood in Billings?
ZIP code 59101 is the most affordable area at $322,037 — roughly 21% below the city median. It also has the lowest rents at $1,186/month. This ZIP offers the best entry point for first-time buyers and the strongest rent-to-price ratio for investors.
Methodology
Home values are based on the Zillow Home Value Index (ZHVI), a smoothed measure of typical home values in the 35th to 65th percentile range. Rent estimates use the Zillow Observed Rent Index (ZORI). Population figures come from the U.S. Census Bureau Population Estimates Program (2020-2024 vintage). All datasets are publicly available. Housing data updated 2026-02-28.