Boston Home Prices: $951K, Down 0.4% — 28 ZIPs Analyzed (2026)
$951,271. That’s what a typical home costs in Boston as of February 2026. Prices have slipped 0.4% from a year ago — a small decline, but a decline nonetheless in a city that rarely gives ground.
Quick answer: The average home price in Boston, MA is $951,271 as of February 2026, down 0.4% year over year according to Zillow.
Current Home Prices in Boston
| Metric | Value |
|---|---|
| Median Home Value | $951,271 |
| Year-over-Year Change | -0.4% |
| Lowest ZIP Value | $591,452 |
| Highest ZIP Value | $3,313,473 |
| ZIP Codes Tracked | 28 |
| Data As Of | February 2026 |
The -0.4% annual drop may not sound like much, but for Boston, it’s notable. This is a market that spent years climbing. The current median puts a typical Boston home well above the national average.
The spread between the cheapest and most expensive neighborhoods tells the real story. The gap is $2.7 million — from under $600K in Mattapan to over $3.3 million in the Back Bay’s 02199 corridor. That kind of range means “Boston” is really 28 different housing markets stitched together.
A 20% down payment on the median home is $190,254. That’s the entry ticket.
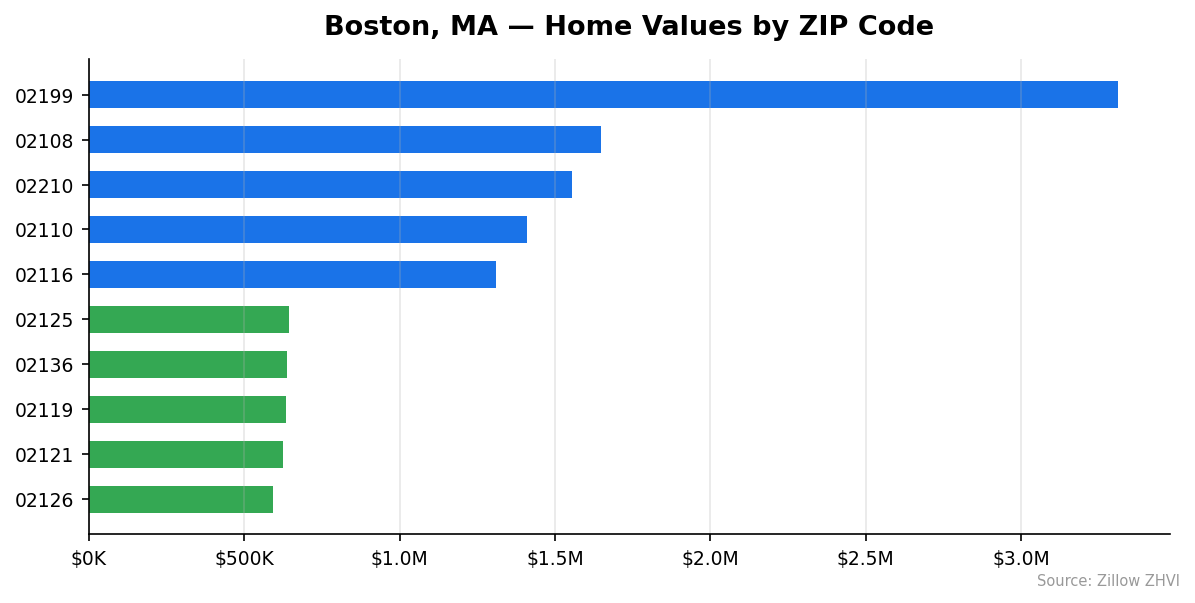
Boston Home Prices by Neighborhood
| ZIP Code | Typical Home Value | Typical Monthly Rent |
|---|---|---|
| 02199 | $3,313,473 | — |
| 02108 | $1,647,596 | $3,217 |
| 02210 | $1,553,480 | $4,033 |
| 02110 | $1,411,672 | $4,300 |
| 02116 | $1,309,473 | $3,554 |
| 02129 | $985,966 | $3,283 |
| 02111 | $962,134 | $3,654 |
| 02118 | $953,032 | $4,094 |
| 02109 | $933,177 | $3,730 |
| 02115 | $866,628 | $3,905 |
| 02120 | $856,403 | $5,318 |
| 02127 | $852,875 | $3,726 |
| 02134 | $799,256 | $3,134 |
| 02132 | $791,312 | $2,735 |
| 02130 | $787,853 | $3,210 |
| 02114 | $724,550 | $3,548 |
| 02113 | $713,613 | $3,371 |
| 02131 | $707,284 | $2,930 |
| 02215 | $690,114 | $3,510 |
| 02124 | $678,786 | $3,039 |
| 02135 | $656,131 | $3,043 |
| 02128 | $655,497 | $3,037 |
| 02122 | $654,423 | $2,961 |
| 02125 | $644,130 | $3,302 |
| 02136 | $638,485 | $2,588 |
| 02119 | $632,837 | $3,846 |
| 02121 | $623,952 | $3,204 |
| 02126 | $591,452 | $3,167 |
Most Expensive ZIPs
02199 — $3,313,473. This Back Bay ZIP commands the highest prices in the city by a wide margin, at nearly 3.5 times the citywide median. No rent data is tracked here, likely due to the concentration of luxury condos.
02108 — $1,647,596. Beacon Hill’s typical home runs 73% above the Boston median, yet rents here are a relatively modest $3,217/month — one of the lower figures in the city, reflecting an ownership market dominated by high-value townhouses.
02210 — $1,553,480. The Seaport District commands both high home values and rents at $4,033/month, making it expensive on both sides of the rent-vs-buy equation.
Most Affordable ZIPs
02126 — $591,452. Mattapan is Boston’s most affordable neighborhood, priced 38% below the city median. Rents here run $3,167/month.
02121 — $623,952. This Dorchester ZIP offers the second-lowest entry point at 34% below median, with rents around $3,204/month.
02119 — $632,837. Roxbury rounds out the bottom three at $632,837, though its rents are notably higher at $3,846/month — creating one of the better price-to-rent ratios for investors.
Rent vs Buy in Boston
The rent-versus-buy math in Boston tilts heavily toward renting right now.
| Cost Component | Monthly Estimate |
|---|---|
| Typical Rent (citywide avg) | ~$3,430 |
| Mortgage Payment (median home, 20% down, 7%) | ~$5,060 |
| Estimated Taxes + Insurance | ~$1,000 |
| Total Ownership Cost | ~$6,060 |
A rough average across all 27 ZIPs with rent data puts typical monthly rent around $3,430. To buy the median $951,271 home with 20% down, you’d finance about $761,000. At a 7% mortgage rate, the principal and interest alone run approximately $5,060 per month. Add property taxes and insurance and you’re looking at roughly $6,060/month.
That’s a $2,630 gap between renting and owning each month — over $31,000 per year.
The exception is the affordable ZIPs. In 02136 (Hyde Park), rents of $2,588/month against a $638,485 home value bring the numbers closer together. But even there, buying costs more month-to-month at current mortgage rates.
One outlier: ZIP 02120 has rent at $5,318/month against a home value of $856,403. That’s one of the few spots where ownership could pencil out compared to renting.
Population Growth and Migration
Boston’s population has been essentially flat over the past four years. The city had 675,522 residents in 2020 and 673,458 in 2024 — a decline of 0.3%.
| Year | Population |
|---|---|
| 2020 | 675,522 |
| 2021 | 658,581 |
| 2022 | 660,080 |
| 2023 | 664,603 |
| 2024 | 673,458 |
The numbers tell a clear recovery story. Boston lost nearly 17,000 residents between 2020 and 2021 — the pandemic effect. Since then, population has climbed back steadily, gaining about 15,000 people over three years. The city is still 2,064 people short of its 2020 peak.
Meanwhile, surrounding Massachusetts cities are growing faster:
| City | 2024 Population | 4-Year Growth |
|---|---|---|
| Worcester | 211,286 | +4.4% |
| Lowell | 120,418 | +4.0% |
| Cambridge | 121,186 | +2.5% |
| Lynn | 103,489 | +2.4% |
| Newton | 90,700 | +2.1% |
Worcester and Lowell are each growing more than 10 times faster than Boston in percentage terms. That pattern — slower growth in the core, faster growth in secondary cities — suggests some buyers and renters are choosing affordability over proximity. For housing demand, flat population means no surge of new buyers pushing prices higher. It also means no exodus driving them lower.
Boston Housing Market Trends
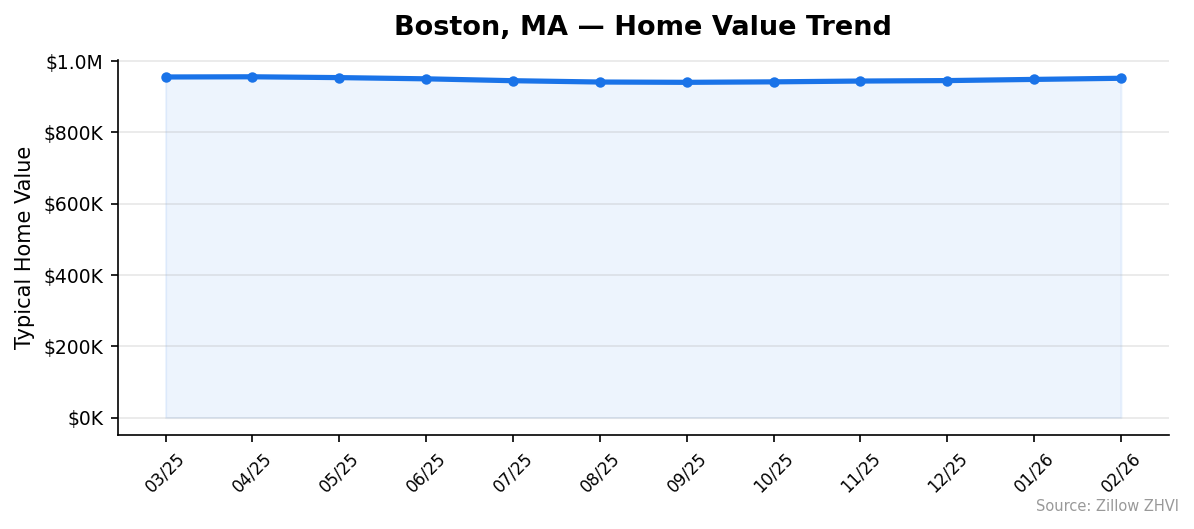
Here’s how Boston’s median home value has moved over the past 12 months:
| Month | Median Value | Change from Prior Month |
|---|---|---|
| Feb 2026 | $951,271 | +$3,200 |
| Jan 2026 | $948,071 | +$3,291 |
| Dec 2025 | $944,780 | +$1,309 |
| Nov 2025 | $943,471 | +$2,249 |
| Oct 2025 | $941,222 | +$1,340 |
| Sep 2025 | $939,882 | -$852 |
| Aug 2025 | $940,734 | -$3,688 |
| Jul 2025 | $944,422 | -$5,272 |
| Jun 2025 | $949,694 | -$3,413 |
| May 2025 | $953,107 | -$2,306 |
| Apr 2025 | $955,413 | +$522 |
| Mar 2025 | $954,891 | — |
The 12-month pattern shows a classic seasonal curve. Prices peaked in April 2025 at $955,413, then declined through September, bottoming out at $939,882. Since October, prices have climbed for five straight months.
The recovery has been gradual — about $11,400 gained since the September low. But the current $951,271 is still $4,142 below the April 2025 peak. Boston hasn’t reclaimed its high-water mark yet.
Is Boston a Good Place to Buy in 2026?
The data points to a market in stalemate.
Sellers still have the upper hand on price — $951K for a median home is not a buyer’s market in any traditional sense. But the -0.4% year-over-year decline and the fact that prices haven’t retaken their spring 2025 peak give buyers slightly more negotiating room than they had a year ago.
The rent-vs-buy gap is the biggest red flag for buyers. You’re paying $2,600+/month more to own versus rent. That only makes sense if you expect significant appreciation, plan to stay 7+ years, or value ownership for non-financial reasons.
If you’re focused on value, the southern Dorchester and Mattapan ZIPs offer entry points under $650K — still steep, but 30-40% below the city median. Roxbury’s high rents relative to home values make it worth examining for investors.
Boston Housing Market Outlook for 2026-2027
The five-month upward trend from October through February suggests prices will continue climbing through spring 2026. If the current pace of roughly $2,500-$3,200 per month holds, Boston could retest or surpass the $955,413 peak from April 2025 sometime in spring.
Seasonal patterns support this. Last year, prices rose from March through April before declining through fall. A similar pattern in 2026 would put the market somewhere between $955K and $965K by late spring.
The headwinds are real, though. Flat population growth means no new demand pressure. The year-over-year number is still negative. And mortgage rates near 7% keep the rent-vs-buy math unfavorable for purchasers. The most likely scenario is modest gains through mid-2026 followed by the usual seasonal cooling.
Similar Markets in MA
If you’re exploring the Boston metro area and want to compare options:
- Worcester — The state’s second-largest city is growing at 4.4% and offers prices well below Boston’s median.
- Cambridge — Just across the river, Cambridge has its own price premium but different neighborhood dynamics.
- Lowell — Growing at 4.0% with prices significantly lower than the Boston core.
- Lynn — North Shore location with population growth of 2.4%, popular with buyers priced out of Boston.
- Brookline — Surrounded by Boston, often comparable in price but with a distinct suburban character.
Frequently Asked Questions
What is the average home price in Boston?
The average home price in Boston is $951,271 as of February 2026. That figure represents the Zillow Home Value Index, which tracks typical home values in the 35th to 65th percentile range. Prices range from $591,452 in the most affordable ZIP to $3,313,473 in the most expensive.
Are home prices going up or down in Boston?
Boston home prices are down 0.4% year over year. However, the short-term trend is upward — prices have risen for five consecutive months since bottoming at $939,882 in September 2025. The market appears to be following its normal seasonal pattern of spring gains.
Is it cheaper to rent or buy in Boston?
Renting is cheaper by a wide margin. The typical Boston rent is approximately $3,430/month, while owning the median-priced home costs roughly $6,060/month including mortgage, taxes, and insurance. That’s a gap of about $2,630 per month, or over $31,000 per year.
What is the most affordable neighborhood in Boston?
ZIP code 02126 (Mattapan) has the lowest typical home value at $591,452 — 38% below the citywide median. The next most affordable areas are 02121 in Dorchester at $623,952 and 02119 in Roxbury at $632,837.
Methodology
Home values are based on the Zillow Home Value Index (ZHVI), a smoothed measure of typical home values in the 35th to 65th percentile range. Rent estimates use the Zillow Observed Rent Index (ZORI). Population figures come from the U.S. Census Bureau Population Estimates Program (2020-2024 vintage). All datasets are publicly available. Housing data updated 2026-02-28.