Jersey City Home Prices: $648K, Down 13.9% — 6 ZIPs Analyzed (2026)
$648K. That’s what a typical home costs in Jersey City right now — and it’s a sharp fall from a year ago.
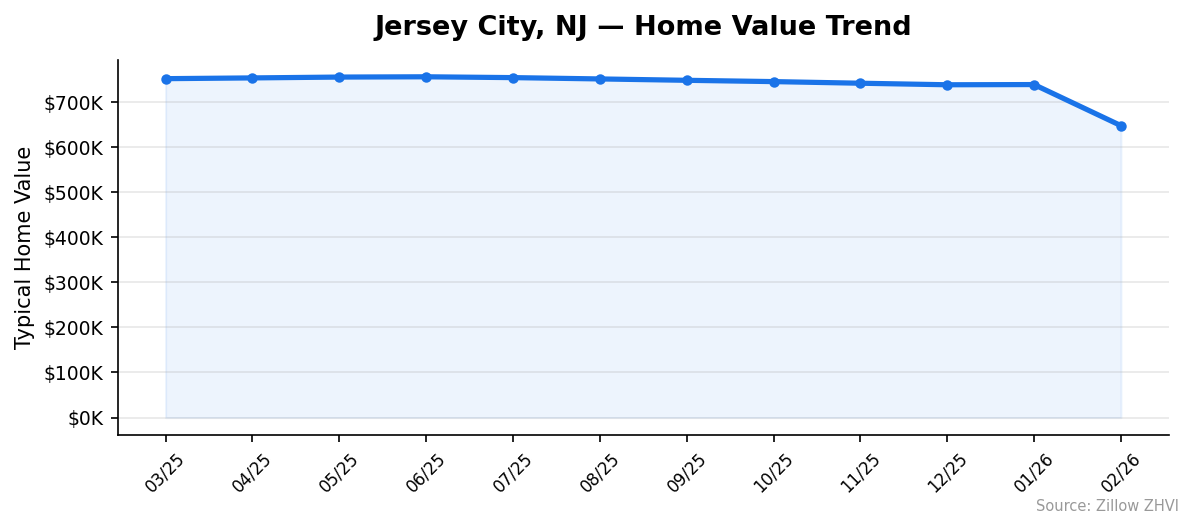
The median home value in Jersey City dropped 13.9% year over year, landing at $647,521 in February 2026. For a city sitting across the Hudson from Manhattan, that kind of decline gets your attention.
Quick answer: The average home price in Jersey City, NJ is $647,521 as of February 2026, down 13.9% year over year according to Zillow.
Current Home Prices in Jersey City
| Metric | Value |
|---|---|
| Median Home Value | $647,521 |
| Year-over-Year Change | -13.9% |
| Lowest ZIP Value | $522,315 |
| Highest ZIP Value | $1,212,100 |
| Number of ZIPs Tracked | 6 |
| Data Month | February 2026 |
A 13.9% annual decline is significant by any measure. Jersey City’s median sat comfortably above $750,000 through most of 2025, peaking near $756K in June. Then the slide accelerated. Between January and February 2026 alone, the city-wide average fell from $738,591 to $647,521.
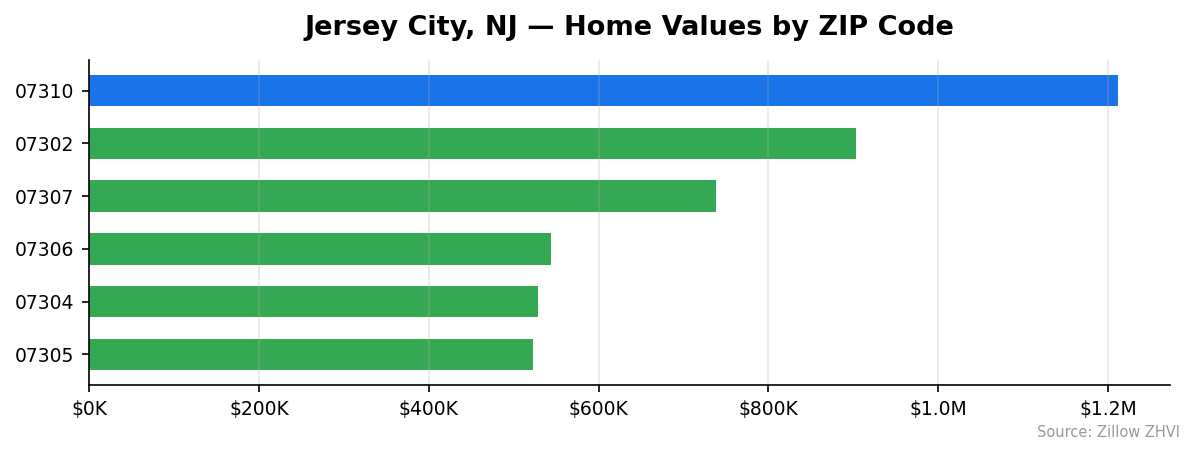
The price range across ZIP codes tells a split story. The most affordable pocket starts at $522K. The priciest neighborhood crosses $1.2 million. That gap — more than $689,000 — means “Jersey City” isn’t one market. It’s several.
Jersey City Home Prices by Neighborhood
| ZIP Code | Median Home Value | Avg. Monthly Rent |
|---|---|---|
| 07302 | $903,241 | $3,720 |
| 07310 | $1,212,100 | $4,261 |
| 07307 | $738,934 | $2,489 |
| 07306 | $543,846 | $2,551 |
| 07304 | $529,272 | $2,373 |
| 07305 | $522,315 | $2,273 |
Most Expensive
07310 leads at $1,212,100 — nearly double the city median — with rents averaging $4,261/month, the highest in the city. 07302 follows at $903,241 with rents of $3,720/month, still 39% above the city-wide median. 07307 rounds out the top three at $738,934, sitting close to where the overall city average was just a few months ago.
Most Affordable
07305 is the entry point at $522,315, with the city’s lowest average rent at $2,273/month. 07304 is nearly as affordable at $529,272, with rents of $2,373. 07306 comes in at $543,846 — still well under the city median but with slightly higher rents at $2,551/month.
The gap between the cheapest and most expensive ZIP is $689,785. If you’re priced out of the waterfront, the western neighborhoods offer homes at less than half the cost.
Rent vs Buy in Jersey City
Here’s the monthly cost breakdown for each ZIP, assuming a 30-year mortgage at 7% with 20% down:
| ZIP | Est. Mortgage (P&I) | Avg. Rent | Difference |
|---|---|---|---|
| 07305 | $2,781 | $2,273 | Rent saves $508 |
| 07304 | $2,818 | $2,373 | Rent saves $445 |
| 07306 | $2,895 | $2,551 | Rent saves $344 |
| 07307 | $3,934 | $2,489 | Rent saves $1,445 |
| 07302 | $4,809 | $3,720 | Rent saves $1,089 |
| 07310 | $6,453 | $4,261 | Rent saves $2,192 |
Renting is cheaper than buying in every single ZIP code — and it’s not close in the expensive ones. In 07310, renting saves over $2,100/month compared to a mortgage payment alone. That calculation doesn’t include property taxes, insurance, or maintenance, which would push the ownership cost even higher.
The most competitive gap is in 07304 and 07305, where the difference narrows to around $450-$500/month. If you’re building equity and plan to stay long-term, those western ZIPs make the strongest case for buying.
Population Growth and Migration
Jersey City’s population reached 302,824 in 2024, up 3.7% from 291,960 in 2020. The city is gaining residents.
| Year | Population |
|---|---|
| 2020 | 291,960 |
| 2021 | 285,143 |
| 2022 | 292,360 |
| 2023 | 298,215 |
| 2024 | 302,824 |
The dip to 285,143 in 2021 stands out — a loss of nearly 7,000 people in a single year. Since then, the city has added roughly 17,700 residents over three years. Growth has been steady at about 5,000-6,000 people per year since 2022.
Nearby City Comparison
| City | 2024 Population | 4-Year Growth |
|---|---|---|
| Newark | 317,303 | 2.1% |
| Jersey City | 302,824 | 3.7% |
| Elizabeth | 140,413 | 2.7% |
| Clifton | 90,322 | 0.8% |
| Bayonne | 74,532 | 4.1% |
| East Orange | 71,850 | 3.5% |
Jersey City is growing faster than most of its neighbors. Only Bayonne, at 4.1%, outpaces it. Newark, despite being the state’s largest city, is growing at just 2.1%. More people means more housing demand — yet prices are falling. That disconnect suggests supply may be catching up, or affordability pressures are pushing buyers elsewhere.
Jersey City Housing Market Trends
| Month | Avg. Home Value | Min | Max |
|---|---|---|---|
| Feb 2026 | $647,521 | $522,315 | $903,241 |
| Jan 2026 | $738,591 | $521,034 | $1,212,100 |
| Dec 2025 | $738,136 | $520,439 | $1,217,205 |
| Nov 2025 | $741,555 | $521,416 | $1,231,295 |
| Oct 2025 | $745,148 | $522,231 | $1,242,258 |
| Sep 2025 | $748,025 | $525,192 | $1,247,729 |
| Aug 2025 | $751,075 | $529,075 | $1,254,329 |
| Jul 2025 | $753,993 | $532,754 | $1,260,576 |
| Jun 2025 | $755,829 | $534,225 | $1,264,158 |
| May 2025 | $755,203 | $532,542 | $1,263,957 |
| Apr 2025 | $753,336 | $530,278 | $1,260,945 |
| Mar 2025 | $751,673 | $527,439 | $1,262,352 |
The 12-month picture shows a market that drifted gently downward through most of 2025, then dropped hard. From March to December 2025, the average fell about $13,500 — a gradual 1.8% decline over nine months. Then in a single month (January to February 2026), it shed $91,070.
The floor of the market barely moved. The cheapest ZIP stayed in the $520K-$534K range throughout the year. All the volatility came from the top. The maximum value fell from $1,262,352 in March 2025 to $903,241 in February 2026 — a 28.4% drop in the city’s most expensive area.
Is Jersey City a Good Place to Buy in 2026?
The numbers point toward a buyer’s market. A 13.9% annual price decline gives buyers more negotiating power than they’ve had in years. If you’re looking at the $500K-$545K range in ZIPs 07304, 07305, or 07306, you’re in the most stable part of the market — those areas barely budged while the expensive neighborhoods corrected sharply.
The risk? Catching a falling knife. Prices are still declining, and the February drop was severe. Buyers who can wait a few months may find better deals. Buyers who need to move now should focus on the western ZIPs where values have held steady and the rent-vs-buy gap is smallest.
One thing working in Jersey City’s favor: population growth. The city is adding thousands of residents each year. That underlying demand doesn’t disappear, even during a price correction.
Jersey City Housing Market Outlook for 2026-2027
The 3-month trend is unmistakable: accelerating decline. Prices fell 1% between March and December 2025, then dropped 12% in the next two months. If the current pace continues, the city-wide average could fall below $600K by mid-2026.
But that projection assumes the February drop wasn’t a one-time correction in the luxury segment. The data shows the lower-priced ZIPs held steady — the collapse came almost entirely from the top end. If luxury prices stabilize, the city-wide average could level off near current levels.
The most likely scenario falls somewhere in between. Expect continued softening through summer 2026, with the pace of decline slowing. The affordable western neighborhoods will likely hold their values better than the waterfront.
Similar Markets in NJ
If you’re exploring the Jersey City area, these nearby New Jersey markets offer different price points:
- Newark — The state’s largest city sits right next door and typically prices well below Jersey City.
- Elizabeth — Another Hudson County neighbor with strong transit connections.
- Clifton — Further from Manhattan but with slower population growth and a quieter market.
- Edison — A Middlesex County option for buyers who want more space for the money.
- Paterson — One of the more affordable cities in northern New Jersey.
Frequently Asked Questions
What is the average home price in Jersey City?
The average home price in Jersey City is $647,521 as of February 2026. This represents the Zillow Home Value Index, which measures typical home values in the 35th-to-65th percentile range. Prices vary widely across the city, from $522,315 in ZIP 07305 to $1,212,100 in ZIP 07310.
Are home prices going up or down in Jersey City?
Prices are falling — and falling fast. Jersey City home values dropped 13.9% year over year. The decline accelerated sharply in early 2026, with the city average falling from $738,591 in January to $647,521 in February.
Is it cheaper to rent or buy in Jersey City?
Renting is cheaper than buying in every Jersey City ZIP code right now. The gap is smallest in the western neighborhoods (07304, 07305) where renting saves about $450-$500/month compared to mortgage principal and interest alone. In the waterfront area (07310), renting saves over $2,100/month before taxes and insurance.
What is the most affordable neighborhood in Jersey City?
ZIP code 07305 is the most affordable at $522,315, followed closely by 07304 at $529,272. Both areas also have the lowest rents in the city, with averages of $2,273 and $2,373 per month respectively. These western neighborhoods have also been the most price-stable over the past year.
Methodology
Home values are based on the Zillow Home Value Index (ZHVI), a smoothed measure of typical home values in the 35th to 65th percentile range. Rent estimates use the Zillow Observed Rent Index (ZORI). Population figures come from the U.S. Census Bureau Population Estimates Program (2020-2024 vintage). All datasets are publicly available. Housing data updated 2026-02-28.