Lancaster Home Prices: $345K, Up 3.6% — 3 ZIPs Analyzed (2026)
$345,317. That’s what a typical home costs in Lancaster, PA right now. Prices climbed 3.6% over the past year, and every single month in the last 12 posted a gain. If you’re shopping here, the window isn’t closing fast — but it is closing.
Quick answer: The average home price in Lancaster, PA is $345,317 as of February 2026, up 3.6% year over year according to Zillow.
Current Home Prices in Lancaster
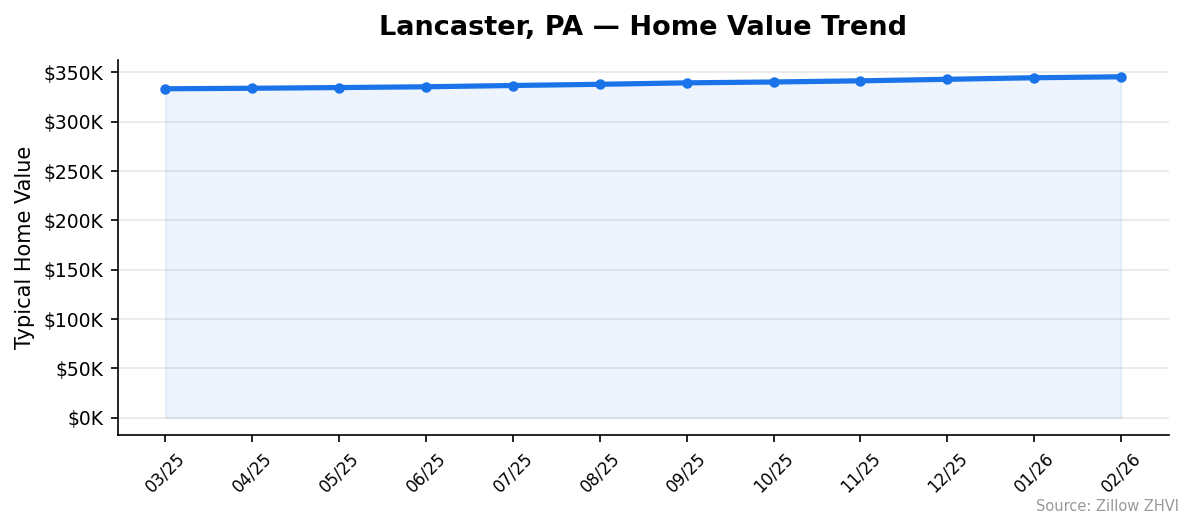
The Lancaster housing market has been on a slow, steady climb. No dramatic spikes, no sudden drops — just consistent upward movement since at least early 2025.
| Metric | Value |
|---|---|
| Median Home Price | $345,317 |
| Year-over-Year Change | +3.6% |
| Lowest ZIP Median | $302,352 |
| Highest ZIP Median | $422,920 |
| Price Spread | $120,568 |
| ZIPs Tracked | 3 |
That $120K spread between the cheapest and most expensive ZIP tells you Lancaster isn’t one market — it’s at least three. A buyer with $300K has options here. A buyer with $425K has different ones.
The 3.6% annual gain is moderate. It’s enough to build equity but not so aggressive that first-time buyers get priced out month by month. For context, a 3.6% gain on a $345K home adds roughly $12,400 in value over a year. That’s real money, but it’s not the double-digit appreciation that burned buyers in Sun Belt cities a few years ago.
February 2026 marked the highest median on record in the dataset at $345,317, up from $333,169 in March 2025. That’s a $12,148 increase in under a year.
Lancaster Home Prices by Neighborhood
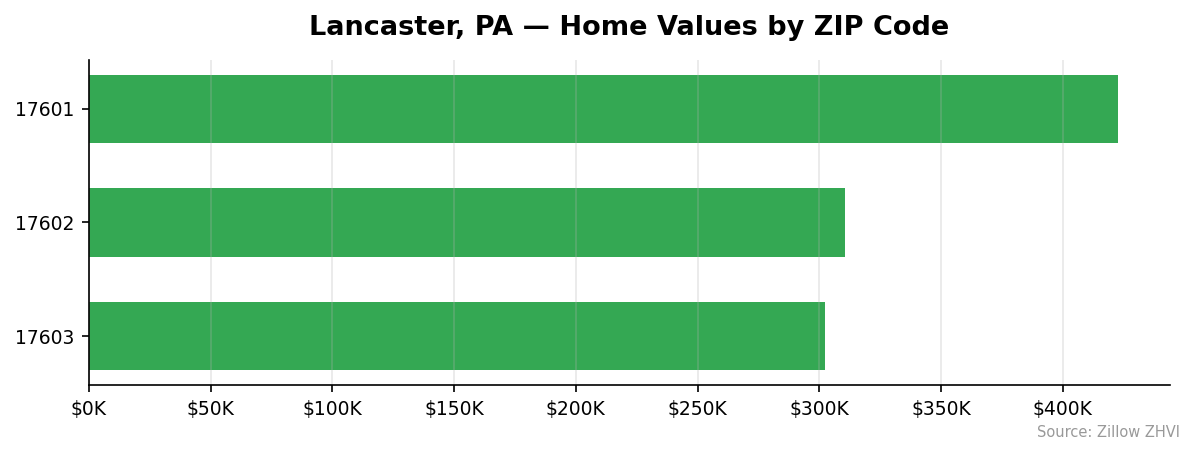
Three ZIP codes cover the Lancaster market. The price gap between them is significant — the most expensive ZIP costs 40% more than the cheapest.
| ZIP Code | Median Home Value | Median Rent |
|---|---|---|
| 17601 | $422,920 | $1,818/mo |
| 17602 | $310,680 | $1,455/mo |
| 17603 | $302,352 | $1,499/mo |
Most Expensive
17601 leads by a wide margin at $422,920 — roughly 22% above the city median. Rents here are also the highest at $1,818 per month, which tracks with the higher property values.
Most Affordable
17603 comes in at $302,352, about 12% below the city average. Interestingly, rents in 17603 ($1,499) are slightly higher than in 17602 ($1,455), meaning renters don’t get the same discount that buyers do.
17602 sits close behind at $310,680 with the lowest rents in the city at $1,455 per month. If you’re optimizing for low monthly costs — whether buying or renting — this ZIP deserves a look.
Rent vs Buy in Lancaster
The rent-vs-buy math in Lancaster leans toward renting on a pure monthly basis, but the gap isn’t enormous.
| ZIP Code | Median Rent | Est. Mortgage Payment* | Difference |
|---|---|---|---|
| 17601 | $1,818/mo | $2,139/mo | +$321/mo to buy |
| 17602 | $1,455/mo | $1,578/mo | +$123/mo to buy |
| 17603 | $1,499/mo | $1,531/mo | +$32/mo to buy |
Estimated mortgage: 20% down, 6.5% rate, 30-year fixed. Principal and interest only — does not include taxes, insurance, or PMI.
In 17603, the gap is just $32 per month. At that point, buying makes financial sense almost immediately because you’re building equity. In 17601, the $321 monthly premium for ownership is steeper, but you’re also in the highest-appreciating ZIP.
The city-wide median rent across all three ZIPs runs about $1,590 per month. A mortgage on the city median of $345,317 (with 20% down) comes to roughly $1,746. That’s a $156 monthly premium to own.
With prices rising 3.6% annually, a Lancaster homeowner gains about $1,033 per month in equity appreciation alone. That more than offsets the higher monthly payment.
Population Growth and Migration
Lancaster’s population story has an unusual shape. The city lost residents from 2020 through 2023, then bounced back sharply in 2024.
| Year | Population | Change |
|---|---|---|
| 2020 | 57,943 | — |
| 2021 | 57,677 | -266 |
| 2022 | 57,335 | -342 |
| 2023 | 57,304 | -31 |
| 2024 | 58,441 | +1,137 |
That 2024 jump of 1,137 residents erased three years of decline and pushed the city to a net gain of 0.9% since 2020. The reversal is notable — Lancaster went from bleeding population to its fastest growth in the dataset in a single year.
How does Lancaster compare to other Pennsylvania cities?
| City | 2024 Population | 4-Year Growth |
|---|---|---|
| Pittsburgh | 307,668 | +1.6% |
| Allentown | 127,138 | +1.1% |
| Reading | 96,000 | +1.1% |
| Bethlehem | 79,453 | +4.9% |
| Lancaster | 58,441 | +0.9% |
| Harrisburg | 50,649 | +1.1% |
Lancaster’s 0.9% growth trails most of its peers. Bethlehem stands out at 4.9%. But Lancaster’s 2024 surge suggests momentum may be shifting. More people means more housing demand, which supports the steady price increases the data already shows.
Lancaster Housing Market Trends
Here’s how the median home price moved month by month over the past year.
| Month | Median Price | Monthly Change |
|---|---|---|
| Mar 2025 | $333,169 | — |
| Apr 2025 | $333,696 | +$527 |
| May 2025 | $334,406 | +$710 |
| Jun 2025 | $335,197 | +$791 |
| Jul 2025 | $336,489 | +$1,292 |
| Aug 2025 | $337,713 | +$1,224 |
| Sep 2025 | $339,180 | +$1,467 |
| Oct 2025 | $340,057 | +$877 |
| Nov 2025 | $341,219 | +$1,162 |
| Dec 2025 | $342,777 | +$1,558 |
| Jan 2026 | $344,358 | +$1,581 |
| Feb 2026 | $345,317 | +$959 |
Twelve straight months of gains. Not a single down month in the dataset.
The pace did accelerate. Early 2025 saw gains of $500-$800 per month. By late 2025, monthly jumps exceeded $1,500. February 2026 cooled slightly to $959, which could be seasonal or the start of a plateau.
Total 12-month gain: $12,148. That works out to just over $1,000 per month in appreciation.
Is Lancaster a Good Place to Buy in 2026?
The data points to a seller’s market, but a mild one.
Prices are rising, not falling. That favors sellers. But 3.6% annual appreciation isn’t runaway growth — it’s manageable for buyers who plan to hold for at least a few years.
The rent-vs-buy gap is narrow, especially in ZIPs 17602 and 17603. If you can afford the down payment, monthly ownership costs aren’t much higher than renting, and you get equity buildup on top.
The population rebound in 2024 adds a demand signal. More residents competing for housing in a city with only three tracked ZIPs puts upward pressure on prices.
For buyers: the best value sits in 17603 and 17602, where you can get in under $315K. For investors: the rent-to-price ratio is strongest in 17602, where low rents still cover a good chunk of a lower purchase price.
Lancaster Housing Market Outlook for 2026-2027
The 12-month trend shows no sign of reversal. Every month posted a gain, and the gains generally grew larger through the second half of 2025.
If the current pace continues, Lancaster’s median could reach the $355K-$360K range by late 2026. The 3-month trend from December 2025 through February 2026 averaged about $1,033 per month in appreciation.
February’s slower gain ($959 vs. January’s $1,581) is worth watching. It could reflect normal winter softness, or it could signal that the acceleration is leveling off. Either way, a price decline would require a sharp trend break that isn’t visible in this data.
The population rebound adds a tailwind. If Lancaster continues attracting new residents at the 2024 rate, housing demand will stay firm.
Similar Markets in PA
If you’re exploring Lancaster, these nearby Pennsylvania markets are worth comparing:
- Philadelphia — Pennsylvania’s largest city with a much bigger market and more ZIP-level variation.
- York — Just 25 miles west of Lancaster, often considered a more affordable alternative.
- Reading — Another mid-sized city in the same region with a population of 96,000.
- Harrisburg — The state capital, similar in size to Lancaster at about 50,600 residents.
- Pittsburgh — A much larger market on the western side of the state for buyers open to relocating further.
Frequently Asked Questions
What is the average home price in Lancaster?
The average home price in Lancaster, PA is $345,317 as of February 2026. That’s based on the Zillow Home Value Index across three tracked ZIP codes. Prices range from $302,352 in the 17603 ZIP to $422,920 in 17601.
Are home prices going up or down in Lancaster?
Prices are going up. The median rose 3.6% year over year, and the market posted 12 consecutive months of gains from March 2025 through February 2026. Monthly increases ranged from $527 to $1,581.
Is it cheaper to rent or buy in Lancaster?
Renting is cheaper on a monthly basis. The city-wide median rent is about $1,590, while a mortgage payment on the median home (20% down, 6.5% rate) runs roughly $1,746. But in ZIP 17603, the gap narrows to just $32 per month — making buying nearly break-even before counting equity gains.
What is the most affordable neighborhood in Lancaster?
ZIP code 17603 is the most affordable at $302,352 — about 12% below the city median. ZIP 17602 is close behind at $310,680. Both offer entry points well under $315K for buyers priced out of the 17601 area.
Methodology
Home values are based on the Zillow Home Value Index (ZHVI), a smoothed measure of typical home values in the 35th to 65th percentile range. Rent estimates use the Zillow Observed Rent Index (ZORI). Population figures come from the U.S. Census Bureau Population Estimates Program (2020-2024 vintage). All datasets are publicly available. Housing data updated 2026-02-28.