Jacksonville Home Prices: $285K, Down 3.1% — 29 ZIPs Analyzed (2026)
$284,843. That’s what a typical home costs in Jacksonville right now — and it’s getting cheaper.
After years of rapid appreciation across Florida, Jacksonville has reversed course. Home values fell 3.1% over the past year. For buyers who felt priced out during the pandemic boom, the math is finally shifting.
Quick answer: The average home price in Jacksonville, FL is $284,843 as of February 2026, down 3.1% year over year according to Zillow.
Current Home Prices in Jacksonville
Here’s where the market stands:
| Metric | Value |
|---|---|
| Median Home Value | $284,843 |
| Year-over-Year Change | -3.1% |
| Lowest ZIP Value | $104,877 |
| Highest ZIP Value | $476,690 |
| Number of ZIPs Tracked | 29 |
| Data as of | February 2026 |
That $284,843 median puts Jacksonville well below the statewide average for major Florida metros. A year ago, the typical home here cost about $14,000 more. The decline has been steady but not steep — roughly $800 per month of lost value on average.
The price range across the city is enormous. The cheapest neighborhoods sit below $105,000 while the most expensive top $476,000. That $372,000 gap means Jacksonville has options for almost every budget, from first-time buyers to move-up purchasers.
Jacksonville Home Prices by Neighborhood
All 29 tracked ZIP codes and their current home values and rents:
| ZIP Code | Median Home Value | Avg Monthly Rent |
|---|---|---|
| 32233 | $476,690 | $1,800 |
| 32224 | $452,947 | $1,655 |
| 32223 | $424,725 | $1,520 |
| 32226 | $380,503 | $2,361 |
| 32225 | $371,236 | $1,740 |
| 32258 | $365,780 | $1,737 |
| 32257 | $342,860 | $1,463 |
| 32204 | $318,800 | $1,646 |
| 32222 | $314,518 | $1,862 |
| 32256 | $312,230 | $1,528 |
| 32246 | $311,070 | $1,623 |
| 32217 | $306,206 | $1,286 |
| 32218 | $294,935 | $1,708 |
| 32221 | $292,722 | $1,957 |
| 32234 | $290,679 | $2,005 |
| 32219 | $288,614 | $1,781 |
| 32220 | $286,207 | $1,798 |
| 32277 | $278,105 | $1,437 |
| 32207 | $273,324 | $1,506 |
| 32216 | $255,686 | $1,602 |
| 32205 | $254,063 | $1,559 |
| 32244 | $253,448 | $1,622 |
| 32211 | $240,681 | $1,457 |
| 32210 | $218,204 | $1,371 |
| 32202 | $158,320 | $1,597 |
| 32208 | $143,035 | $1,362 |
| 32206 | $126,242 | $1,286 |
| 32254 | $123,754 | $1,263 |
| 32209 | $104,877 | $1,177 |
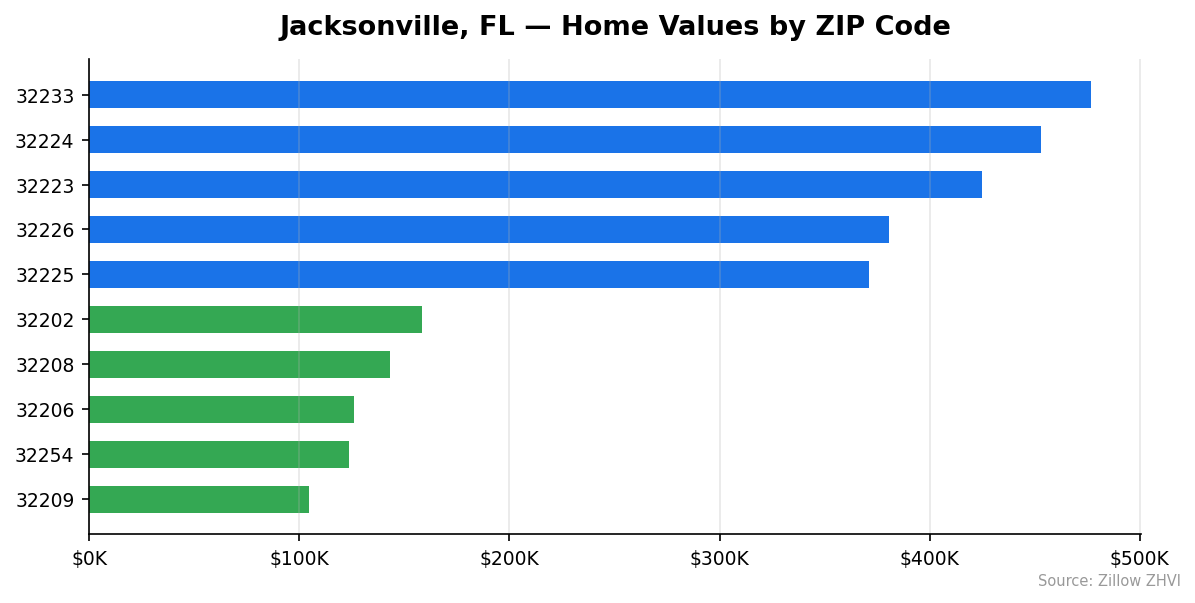
Most Expensive ZIPs
32233 leads at $476,690 — the Jacksonville Beaches area commands a 67% premium over the city median, with rents averaging $1,800. 32224 follows at $452,947, another coastal-adjacent ZIP where home values nearly double the city average. 32223 rounds out the top three at $424,725, a south Jacksonville corridor where buyers pay top dollar but rents stay moderate at $1,520.
Most Affordable ZIPs
32209 is the cheapest ZIP in Jacksonville at $104,877 — just 37% of the citywide median. Rents here average $1,177, the lowest in the city. 32254 comes in at $123,754, offering entry-level pricing on the Westside. 32206 at $126,242 sits in the urban core north of downtown, where rents of $1,286 remain well below the city average.
Rent vs Buy in Jacksonville
Monthly rent across Jacksonville’s 29 tracked ZIPs averages roughly $1,600. How does that compare to owning?
A buyer purchasing at the $284,843 median with 20% down ($56,969) finances $227,874. At a 7% fixed rate over 30 years, the principal and interest payment comes to about $1,516 per month. Add property taxes and insurance — Florida’s are not cheap — and the true monthly cost of ownership runs closer to $1,900-$2,100.
On a pure monthly payment basis, renting is cheaper. But you’re building no equity.
The math changes at lower price points. In ZIP 32209, a home at $104,877 with 20% down produces a mortgage payment around $559 per month. Rents there run $1,177. Buying in that ZIP code saves you more than $600 per month compared to renting — a rare gap.
At the high end, 32226 stands out as an outlier. Home values of $380,503 pair with rents of $2,361, the highest in the city. Renters there are paying a premium that could cover a mortgage on a more expensive home.
Population Growth and Migration
Jacksonville crossed the one million mark. The city’s 2024 population reached 1,009,833 — up 6.1% from 951,925 in 2020.
| Year | Population |
|---|---|
| 2020 | 951,925 |
| 2021 | 957,537 |
| 2022 | 975,614 |
| 2023 | 993,468 |
| 2024 | 1,009,833 |
That’s roughly 14,500 new residents per year. Growth was slowest in 2021 (5,600 added) and fastest in 2022 (18,077 added), likely reflecting pandemic-era migration into Florida.
How does Jacksonville compare to other Florida cities?
| City | 2024 Population | 4-Year Growth |
|---|---|---|
| Port St. Lucie | 258,575 | 25.0% |
| Cape Coral | 233,025 | 19.2% |
| Miami | 487,014 | 10.0% |
| Orlando | 334,854 | 8.8% |
| Tampa | 414,547 | 6.7% |
| Jacksonville | 1,009,833 | 6.1% |
Jacksonville’s 6.1% growth rate is the slowest on this list, but the city started from a much larger base. In absolute numbers, Jacksonville added more people than Cape Coral or Port St. Lucie. A growing population generally supports housing demand, though falling prices suggest supply is keeping pace — or buyers are simply tapped out at current rates.
Jacksonville Housing Market Trends
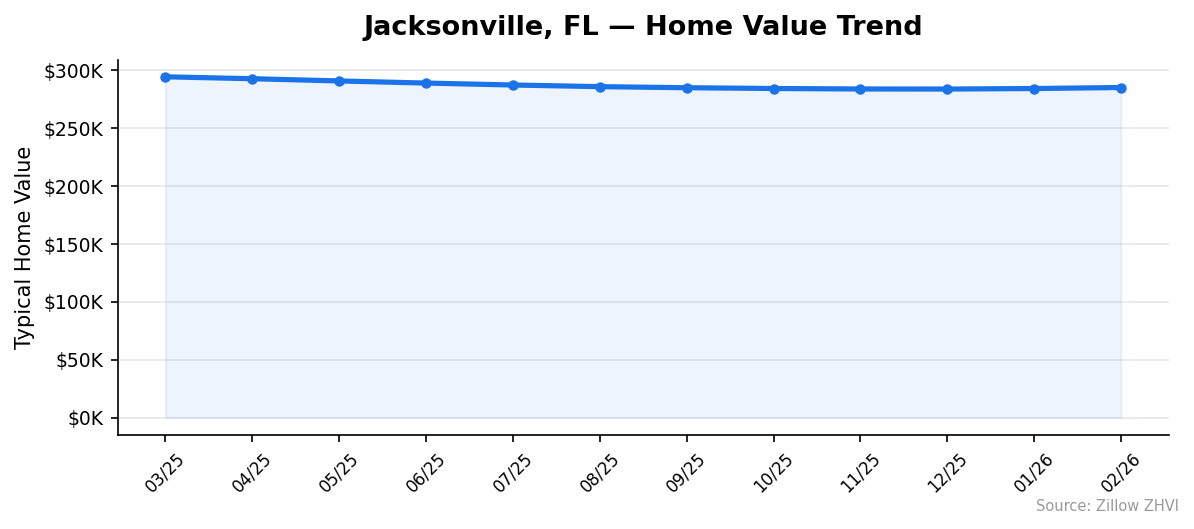
Here’s how home values moved month by month over the past year:
| Month | Avg Home Value | Min ZIP | Max ZIP |
|---|---|---|---|
| Mar 2025 | $294,095 | $111,574 | $491,027 |
| Apr 2025 | $292,425 | $110,495 | $487,825 |
| May 2025 | $290,507 | $108,909 | $483,749 |
| Jun 2025 | $288,675 | $107,610 | $480,037 |
| Jul 2025 | $287,008 | $106,728 | $477,117 |
| Aug 2025 | $285,581 | $106,374 | $474,632 |
| Sep 2025 | $284,657 | $105,873 | $473,750 |
| Oct 2025 | $283,987 | $105,251 | $473,491 |
| Nov 2025 | $283,586 | $104,313 | $473,953 |
| Dec 2025 | $283,517 | $103,933 | $474,348 |
| Jan 2026 | $283,970 | $104,244 | $475,210 |
| Feb 2026 | $284,843 | $104,877 | $476,690 |
The trend tells a clear story. Prices fell steadily from March 2025 ($294,095) through December 2025 ($283,517) — a $10,578 drop over nine months. Then something shifted. January and February showed small but real increases, with values climbing $1,326 in the last two months.
The floor was $283,517 in December. The most expensive ZIPs bottomed out around $473,491 in October before ticking back up. The cheapest ZIPs hit their low in December at $103,933.
Both ends of the market appear to have found a floor at the same time.
Is Jacksonville a Good Place to Buy in 2026?
The numbers point to a buyer-friendly market. Prices are down 3.1% year over year. Inventory has clearly loosened — you can’t get sustained monthly declines without more homes available than buyers willing to pay last year’s prices.
At $284,843, Jacksonville sits well below Florida peers like Tampa and Miami. You get a major metro with over a million people, a port, military bases, and a cost of entry under $300,000.
The rent-vs-buy math works in certain ZIPs. If you’re paying $1,600 in rent and can buy in the $200,000-$250,000 range, ownership starts making financial sense even at 7% rates.
Risk factors: Florida insurance costs continue to climb, and property taxes on a $285,000 home are not trivial. The 3.1% price decline could continue if mortgage rates stay elevated. But for buyers with stable income and a long time horizon, the correction has created real opportunities that didn’t exist two years ago.
Jacksonville Housing Market Outlook for 2026-2027
The recent two-month uptick — from $283,517 in December to $284,843 in February — suggests the decline may be bottoming out. The pace of monthly increases is small (about $660 per month), so don’t expect a sharp rebound.
If the current pace continues through spring and summer, values could recover to the $287,000-$290,000 range by mid-2026. That would still leave prices below where they were a year ago.
The 3-month trend suggests stabilization rather than renewed growth. Prices fell fast from March through October 2025, then flattened, and now show modest gains. This pattern is consistent with a market finding its new equilibrium.
Watch mortgage rates. Any meaningful drop below 7% would likely accelerate the recovery. Rates staying put means this slow grind continues.
Similar Markets in FL
If you’re considering Jacksonville, these Florida cities offer useful comparisons:
- Tampa — Slightly larger metro with higher price points, about an hour south on I-75.
- Port Saint Lucie — Florida’s fastest-growing city at 25% over four years, attracting buyers priced out of South Florida.
- Orlando — Central Florida’s job market hub with 8.8% population growth.
- Fort Lauderdale — South Florida prices at a premium, but worth comparing if you’re flexible on location.
- Hialeah — One of the more affordable options in the Miami-Dade area.
Frequently Asked Questions
What is the average home price in Jacksonville?
The average home price in Jacksonville is $284,843 as of February 2026. Prices across the city’s 29 tracked ZIP codes range from $104,877 to $476,690, giving buyers a wide spectrum of options.
Are home prices going up or down in Jacksonville?
Home prices are down 3.1% compared to a year ago. However, the most recent two months (January and February 2026) showed small increases, suggesting the decline may be leveling off. From March to December 2025, values dropped steadily by about $10,500.
Is it cheaper to rent or buy in Jacksonville?
At the city median of $284,843 with 20% down and a 7% rate, your mortgage payment would be roughly $1,516 per month — before taxes and insurance. Average rent runs about $1,600. On a base payment, buying is slightly cheaper, but total ownership costs (taxes, insurance, maintenance) push it higher. In cheaper ZIPs like 32209, buying is significantly cheaper than renting.
What is the most affordable neighborhood in Jacksonville?
ZIP code 32209 has the lowest home values in Jacksonville at $104,877. That’s 63% below the city median. Rents in 32209 average $1,177 per month, also the lowest in the city. Nearby ZIPs 32254 ($123,754) and 32206 ($126,242) offer similar entry-level pricing.
Methodology
Home values are based on the Zillow Home Value Index (ZHVI), a smoothed measure of typical home values in the 35th to 65th percentile range. Rent estimates use the Zillow Observed Rent Index (ZORI). Population figures come from the U.S. Census Bureau Population Estimates Program (2020-2024 vintage). All datasets are publicly available. Housing data updated 2026-02-28.