Laredo Home Prices: $207K, Up 2.8% — 5 ZIPs Analyzed (2026)
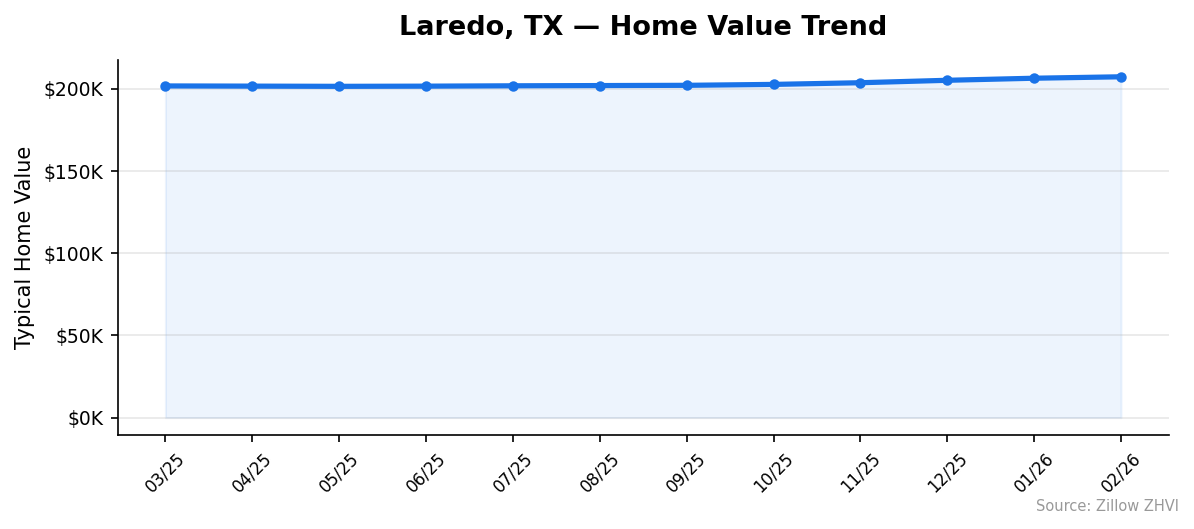
$207,228. That’s what a typical home costs in Laredo right now. Prices are up 2.8% from a year ago, and they’ve climbed every single month since spring 2025. For a border city of 261,000 people, that price tag still lands well below the Texas average.
Quick answer: The average home price in Laredo, TX is $207,228 as of February 2026, up 2.8% year over year according to Zillow.
Current Home Prices in Laredo
| Metric | Value |
|---|---|
| Median Home Value | $207,228 |
| Year-over-Year Change | +2.8% |
| Lowest ZIP Median | $134,644 |
| Highest ZIP Median | $290,319 |
| ZIP Codes Tracked | 5 |
| Data Through | February 2026 |
The gap between the cheapest and most expensive neighborhoods is $155,675. That’s a wide spread for a mid-size city and tells you that location matters a lot within Laredo’s borders.
A 2.8% annual gain puts Laredo in modest-growth territory. You’re not seeing the wild swings that hit Austin or Dallas in recent years. The market here has been steady — almost boring. For buyers, boring is good.
One thing to watch: the pace picked up over the winter months. From October 2025 to February 2026, the median jumped about $4,600. That’s faster than the spring-to-fall stretch, when prices barely moved at all.
Laredo Home Prices by Neighborhood
| ZIP Code | Median Home Value |
|---|---|
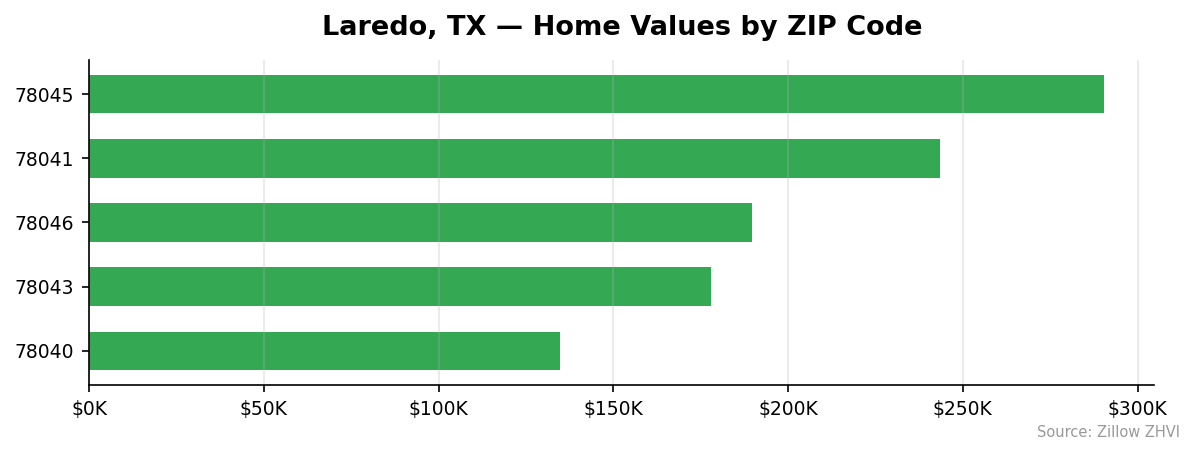
| 78045 | $290,319 |
| 78041 | $243,591 |
| 78046 | $189,680 |
| 78043 | $177,907 |
| 78040 | $134,644 |
Most Expensive
78045 tops the list at $290,319 — roughly 40% above the city median and the only ZIP with available rent data. 78041 follows at $243,591, sitting about $36K above the citywide average. These two ZIPs account for the upper tier of the Laredo market.
Most Affordable
78040 is the clear bargain at $134,644, a full 35% below the city median. 78043 comes in at $177,907, and 78046 at $189,680 — both under the $200K mark. If you’re looking for entry-level pricing in Laredo, these three ZIPs are where the math works best.
Rent vs Buy in Laredo
Rent data is limited for Laredo. Only one ZIP code — 78045 — has tracked rent figures, showing a typical rent of $1,516 per month.
That ZIP has the highest home values in the city at $290,319. A conventional mortgage on that amount (20% down, 6.5% rate, 30-year term) would run roughly $1,468 per month in principal and interest alone. Add property taxes and insurance, and you’re looking at $2,100 or more.
At $1,516 in rent versus $2,100+ to own, renting is cheaper in 78045 on a monthly basis. Of course, ownership builds equity, and Texas has no state income tax — but the monthly cash flow gap is real.
For the more affordable ZIPs like 78040, a mortgage on a $134,644 home would cost around $680/month in principal and interest. If rents in those areas track anywhere near the 78045 figure, buying could be the better deal. But without confirmed rent data for those ZIPs, that’s speculative.
Population Growth and Migration
Laredo’s population reached 261,260 in 2024. That’s a 2.3% increase from 255,495 in 2020 — steady growth, though not explosive.
| Year | Population |
|---|---|
| 2020 | 255,495 |
| 2021 | 255,727 |
| 2022 | 256,650 |
| 2023 | 258,922 |
| 2024 | 261,260 |
Growth accelerated in 2023 and 2024. The city added just 1,155 people in its first two post-Census years combined, then gained 4,610 over the next two. Something shifted.
Here’s how Laredo stacks up against other Texas cities:
| City | 2024 Population | 4-Year Growth |
|---|---|---|
| Fort Worth | 1,008,106 | 9.1% |
| San Antonio | 1,526,656 | 6.1% |
| Lubbock | 272,086 | 5.4% |
| Houston | 2,390,125 | 4.0% |
| Austin | 993,588 | 2.9% |
| Laredo | 261,260 | 2.3% |
Laredo’s growth trails every city on this list. But it’s still growing, and more people means more housing demand. At 2.3%, the population pressure on prices is gentle — consistent with the 2.8% home price gain.
Laredo Housing Market Trends
| Month | Average Median | Low | High |
|---|---|---|---|
| Feb 2026 | $207,228 | $134,644 | $290,319 |
| Jan 2026 | $206,355 | $132,783 | $289,840 |
| Dec 2025 | $205,098 | $130,346 | $289,036 |
| Nov 2025 | $203,616 | $127,789 | $287,641 |
| Oct 2025 | $202,602 | $126,315 | $286,235 |
| Sep 2025 | $202,038 | $126,459 | $284,713 |
| Aug 2025 | $201,892 | $127,590 | $283,430 |
| Jul 2025 | $201,746 | $128,500 | $282,557 |
| Jun 2025 | $201,531 | $128,684 | $282,023 |
| May 2025 | $201,424 | $128,585 | $281,503 |
| Apr 2025 | $201,549 | $128,888 | $281,080 |
| Mar 2025 | $201,662 | $129,394 | $280,777 |
Twelve straight months of gains. Not a single down month in the data.
The pattern is clear: prices flatlined from March through August 2025, hovering around $201,500. Then they broke higher starting in September. The last five months added about $5,200 to the median — most of the annual gain happened in that stretch.
The floor dropped too. The cheapest ZIP fell from $129,394 in March 2025 to $126,315 in October before bouncing back to $134,644 by February. That $8,000 swing at the bottom suggests some affordable-tier volatility that the citywide average masks.
Is Laredo a Good Place to Buy in 2026?
The numbers point to a balanced market tilting slightly toward sellers. A 2.8% annual gain is healthy but not overheated. You’re not competing against double-digit appreciation or panic buying.
What works in Laredo’s favor for buyers: the entry price. At $207K, you can get a mortgage that doesn’t consume your entire paycheck. Three of the five tracked ZIPs sit below $190K. Compare that to Austin at $568K or Dallas at $350K+.
What works against you: momentum. Prices have risen every month for a year, and the pace is accelerating into 2026. Waiting hasn’t gotten cheaper here.
For investors, the limited rent data makes it hard to calculate cap rates across most of the city. The one ZIP with rent data (78045) doesn’t show a favorable rent-to-price ratio. The affordable ZIPs might pencil out better, but you’d need local rent comps to confirm.
Laredo Housing Market Outlook for 2026-2027
The three-month trend from December 2025 to February 2026 shows prices rising about $700/month. If that pace continues, Laredo could cross $210K by mid-2026 and approach $215K by year’s end.
There’s no sign of a slowdown in the data. The gains actually accelerated in late 2025, with the October-to-February stretch outpacing the April-to-September period by a wide margin.
Population growth supports continued demand, though Laredo’s 2.3% growth rate won’t drive a housing boom on its own. The more likely scenario is a continued slow grind higher — the kind of market where you don’t get rich quick but you don’t lose your shirt either.
Similar Markets in TX
If you’re looking at Laredo, these Texas cities offer different price points:
- El Paso — Another border city with a similar cost profile, worth comparing side-by-side with Laredo.
- Brownsville — South Texas and likely in the same affordability range as Laredo.
- San Antonio — A bigger city with more inventory, though prices run higher.
- Edinburg — Rio Grande Valley market, close in geography and price tier.
- Houston — Texas’s largest metro, with far more ZIP codes and a wider price range.
Frequently Asked Questions
What is the average home price in Laredo?
The median home value in Laredo is $207,228 as of February 2026. That figure covers all five tracked ZIP codes, which range from $134,644 in 78040 to $290,319 in 78045.
Are home prices going up or down in Laredo?
Prices are going up. Laredo’s median rose 2.8% year over year, and the city hasn’t posted a single down month in the past 12 months of data. The gains accelerated in late 2025.
Is it cheaper to rent or buy in Laredo?
Rent data is only available for one ZIP — 78045, where typical rent runs $1,516/month. In that area, renting is cheaper than buying on a monthly basis, since a mortgage on a $290K home would exceed $2,100/month with taxes and insurance. For cheaper ZIPs, buying likely wins, but confirmed rent data isn’t available.
What is the most affordable neighborhood in Laredo?
ZIP code 78040 has the lowest median home value at $134,644 — roughly $72,500 below the city average. ZIP codes 78043 ($177,907) and 78046 ($189,680) are also below $200K.
Methodology
Home values are based on the Zillow Home Value Index (ZHVI), a smoothed measure of typical home values in the 35th to 65th percentile range. Rent estimates use the Zillow Observed Rent Index (ZORI). Population figures come from the U.S. Census Bureau Population Estimates Program (2020-2024 vintage). All datasets are publicly available. Housing data updated 2026-02-28.