Average Home Price in Long Beach CA (2026): Trends & Data
Can you still afford a house in Long Beach? $839,243 — that’s the median home value as of February 2026. Prices crept up 0.7% over the past year, one of the slower rates of appreciation in Southern California.
Quick answer: The average home price in Long Beach, CA is $839,243 as of February 2026, up 0.7% year over year according to Zillow.
Current Home Prices in Long Beach
Long Beach sits in the Los Angeles-Long Beach-Anaheim metro, one of the most expensive housing markets in the country. Here’s where things stand.
| Metric | Value |
|---|---|
| Median Home Value | $839,243 |
| Year-over-Year Change | +0.7% |
| Lowest ZIP Value | $490,435 |
| Highest ZIP Value | $1,311,812 |
| Number of ZIP Codes | 11 |
| Data as of | February 2026 |
A 0.7% annual increase translates to roughly $5,800 in added value over the past year. That barely keeps pace with inflation. For buyers, this is relative stability. For sellers hoping for a quick windfall, the numbers don’t support that expectation.
The spread between the cheapest and most expensive ZIP codes is $821,377. That gap tells you Long Beach is not one market — it’s several. A home in the most affordable pocket costs less than half the city median, while the priciest areas push past $1.3 million.
Long Beach Home Prices by Neighborhood
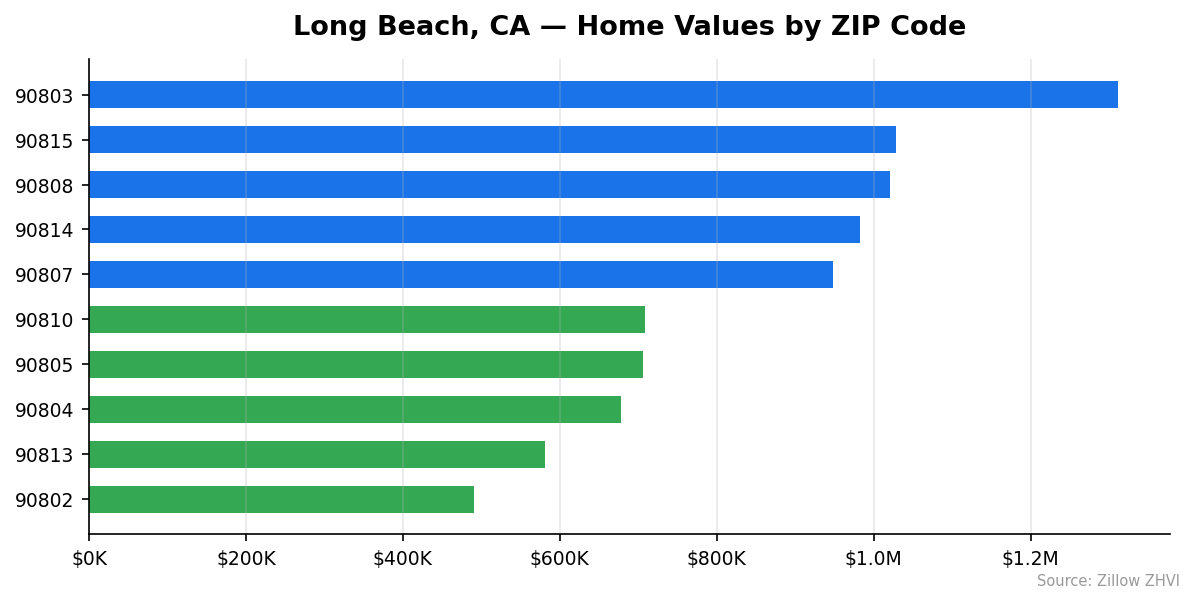
Not all neighborhoods in Long Beach carry the same price tag. The table below breaks down every ZIP code by median home value and typical rent.
| ZIP Code | Median Home Value | Typical Rent |
|---|---|---|
| 90803 | $1,311,812 | $2,522/mo |
| 90815 | $1,028,080 | $2,867/mo |
| 90808 | $1,021,247 | $2,993/mo |
| 90814 | $983,053 | $2,288/mo |
| 90807 | $948,245 | $2,335/mo |
| 90806 | $774,895 | $1,918/mo |
| 90810 | $708,744 | $2,306/mo |
| 90805 | $705,624 | $1,973/mo |
| 90804 | $677,820 | $2,129/mo |
| 90813 | $581,723 | $1,861/mo |
| 90802 | $490,435 | $2,483/mo |
Most Expensive
90803 leads at $1,311,812 — 56% above the city median — yet rents there are only $2,522/month, suggesting a market driven by homeowners, not investors.
90815 comes in at $1,028,080 with rents of $2,867/month, making it one of the pricier areas for both buying and renting.
90808 is close behind at $1,021,247 and has the highest typical rent in the city at $2,993/month.
Most Affordable
90802 is the most affordable ZIP at $490,435, but its rent of $2,483/month is surprisingly high relative to home values — a sign of strong rental demand.
90813 comes in at $581,723 with the lowest rent in the city at $1,861/month, offering the cheapest entry point for both renters and buyers.
90804 rounds out the bottom three at $677,820 with rent at $2,129/month.
Rent vs Buy in Long Beach
The average rent across Long Beach’s 11 ZIP codes is approximately $2,334 per month. A mortgage on the median-priced home of $839,243 — assuming 20% down, a 6.5% rate, and a 30-year term — runs about $4,245/month in principal and interest alone. Add property taxes and insurance, and the real monthly cost of ownership pushes past $5,500.
That’s a $3,166 gap between renting and owning.
| Scenario | Monthly Cost |
|---|---|
| City-wide average rent | ~$2,334 |
| Mortgage (P&I, 20% down, 6.5%) | ~$4,245 |
| Estimated total ownership cost | ~$5,500 |
The math favors renting in the short term. But renters build no equity. Over 10 years, a homeowner paying $5,500/month would have roughly $200,000 in equity from principal paydown alone, excluding any appreciation.
One quirk in the data: 90802 has the lowest home value ($490,435) but charges $2,483 in rent. That’s a price-to-rent ratio that favors buying over renting in that specific ZIP. Buyers on a budget should look there first.
Population Growth and Migration
Long Beach is losing residents. The city’s population fell from 465,593 in 2020 to 450,901 in 2024 — a decline of 3.2% over four years.
| Year | Population |
|---|---|
| 2020 | 465,593 |
| 2021 | 455,157 |
| 2022 | 454,168 |
| 2023 | 451,762 |
| 2024 | 450,901 |
The sharpest drop came between 2020 and 2021, when the city lost over 10,000 residents. The pace has slowed since then, but the trend remains downward.
Compare that to other California cities:
| City | 2024 Population | 4-Year Growth |
|---|---|---|
| San Diego | 1,404,452 | +1.4% |
| Fresno | 550,105 | +1.4% |
| Sacramento | 535,798 | +1.9% |
| Bakersfield | 417,468 | +3.0% |
| Stockton | 324,975 | +1.2% |
| Long Beach | 450,901 | -3.2% |
Every comparable city on this list is growing. Long Beach is the outlier. A shrinking population typically eases housing demand, which may explain the modest 0.7% price growth while inland cities with population gains see stronger appreciation.
Long Beach Housing Market Trends
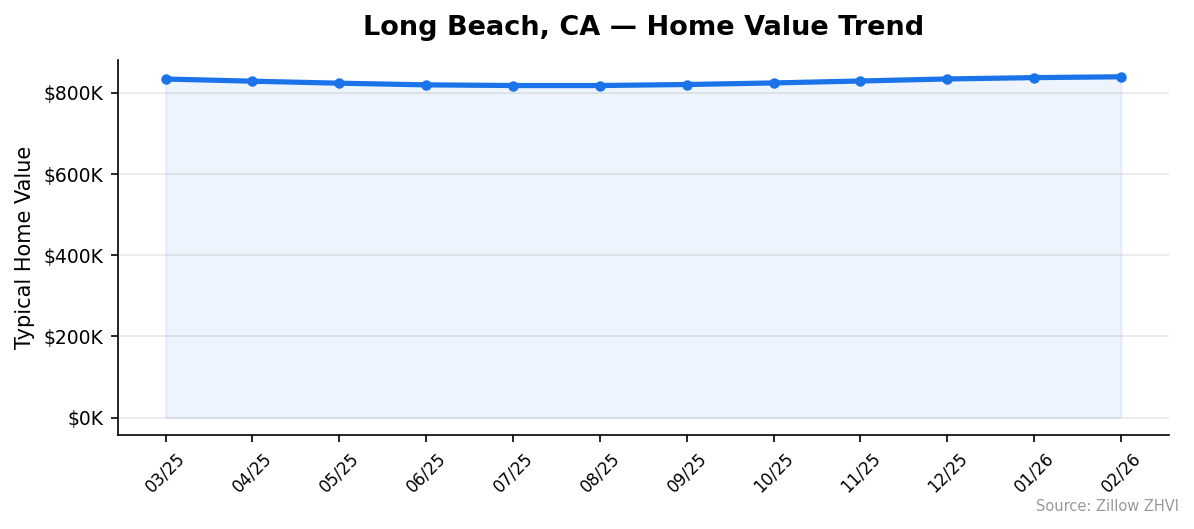
Here’s how the median home value has moved over the past 12 months.
| Month | Median Value | Min (ZIP) | Max (ZIP) |
|---|---|---|---|
| Feb 2026 | $839,243 | $490,435 | $1,311,812 |
| Jan 2026 | $837,195 | $490,642 | $1,308,430 |
| Dec 2025 | $833,915 | $491,196 | $1,303,199 |
| Nov 2025 | $828,880 | $492,022 | $1,294,845 |
| Oct 2025 | $824,112 | $492,952 | $1,285,457 |
| Sep 2025 | $820,207 | $493,975 | $1,278,693 |
| Aug 2025 | $817,721 | $495,360 | $1,274,101 |
| Jul 2025 | $817,724 | $497,627 | $1,274,930 |
| Jun 2025 | $819,361 | $500,980 | $1,276,449 |
| May 2025 | $823,502 | $505,101 | $1,281,064 |
| Apr 2025 | $828,382 | $509,227 | $1,284,900 |
| Mar 2025 | $833,790 | $512,479 | $1,289,726 |
The pattern is clear: prices dipped from March 2025 through August 2025, then reversed course. The median dropped from $833,790 in March to $817,721 in August — a decline of about $16,000. Since then, values have climbed steadily for six consecutive months.
Notice the cheapest ZIP (90802) moved in the opposite direction. Its value dropped from $512,479 in March 2025 to $490,435 in February 2026. Affordable areas are getting cheaper while expensive areas get pricier — widening the gap within the city.
Is Long Beach a Good Place to Buy in 2026?
The data paints a mixed picture.
On the positive side: prices are stable, appreciation is slow, and competition isn’t as fierce as in cities with faster growth. A 0.7% annual increase means buyers aren’t chasing a runaway market. There’s time to shop without panic.
On the other hand: Long Beach is losing population while prices remain high. The median home costs $839,243 in a city where the average rent is $2,334/month. That disconnect between ownership costs and rental costs means the financial case for buying relies heavily on long-term appreciation.
For buyers who plan to stay 7-10 years, the stability is an advantage. For short-term buyers or investors, the numbers are harder to justify.
Long Beach Housing Market Outlook for 2026-2027
The six-month upward trend from August 2025 to February 2026 shows steady momentum — about $3,600 per month in gains. If that pace continues, the median could approach $860,000 by mid-2026.
But the first half of 2025 showed prices can also soften. The March-to-August dip suggests seasonal patterns play a role. Expect some flattening in summer 2026 if the pattern repeats.
The 3-month trend from December 2025 to February 2026 shows acceleration: gains of $3,280, then $2,048 monthly. That’s modest but consistent.
With population still declining and appreciation under 1%, don’t expect a price surge. The most likely scenario for the next 12 months is continued slow growth in the 1-3% range.
Similar Markets in CA
If you’re shopping in Long Beach, these California markets are worth comparing:
- Los Angeles — the metro anchor, with a far larger inventory but similar price pressures.
- Anaheim — nearby in the same metro, with a different mix of neighborhoods and price points.
- San Diego — a growing coastal city that offers a comparison on how population growth affects pricing.
- Bakersfield — for buyers priced out of the coast, Bakersfield offers significantly lower entry points with 3.0% population growth.
- Riverside — an Inland Empire option with more space and lower prices than coastal LA County.
Frequently Asked Questions
What is the average home price in Long Beach?
The median home value in Long Beach is $839,243 as of February 2026. Prices range from $490,435 in ZIP code 90802 to $1,311,812 in 90803. The city-wide figure represents the typical home in the 35th to 65th percentile range.
Are home prices going up or down in Long Beach?
Prices are up 0.7% year over year. After a dip in mid-2025, values have risen for six straight months. The current trend is upward, but the pace is slow compared to most California markets.
Is it cheaper to rent or buy in Long Beach?
Renting is significantly cheaper on a monthly basis. The average rent across the city is about $2,334/month, while ownership costs on a median-priced home run roughly $5,500/month including principal, interest, taxes, and insurance. The gap narrows over time as you build equity.
What is the most affordable neighborhood in Long Beach?
ZIP code 90802 has the lowest median home value at $490,435 — 42% below the city-wide median. It also has relatively high rent at $2,483/month, which means the price-to-rent ratio there is more favorable for buyers than in most other Long Beach neighborhoods.
Methodology
Home values are based on the Zillow Home Value Index (ZHVI), a smoothed measure of typical home values in the 35th to 65th percentile range. Rent estimates use the Zillow Observed Rent Index (ZORI). Population figures come from the U.S. Census Bureau Population Estimates Program (2020-2024 vintage). All datasets are publicly available. Housing data updated 2026-02-28.