North Las Vegas Home Prices: $411K, Down 1.6% — 7 ZIPs Analyzed (2026)
$410,923. That’s what a typical home costs in North Las Vegas right now. A year ago, you’d have paid about $6,700 more. Prices have been drifting lower since spring 2025, putting buyers in a slightly better position than they’ve had in years.
Quick answer: The average home price in North Las Vegas, NV is $410,923 as of February 2026, down 1.6% year over year according to Zillow.
Current Home Prices in North Las Vegas
The median home in North Las Vegas sits at $410,923. That’s a 1.6% drop compared to the same time last year, when prices were closer to $418,000.
| Metric | Value |
|---|---|
| Median home value | $410,923 |
| Year-over-year change | -1.6% |
| Lowest ZIP median | $297,313 |
| Highest ZIP median | $505,833 |
| Number of ZIP codes tracked | 7 |
| Data as of | February 2026 |
The spread between the cheapest and most expensive neighborhoods is over $208,000. That gap tells you North Las Vegas isn’t one market — it’s several, stacked on top of each other. A buyer priced out of the northwest side can still find options in the southeast for well under $300,000.
The 1.6% annual decline is modest. This isn’t a crash. It’s a slow leak. Prices peaked near $418,000 in March 2025 and have shed roughly $7,000 since then. For context, the all-time high in the data was $508,012 for the priciest ZIP code, recorded in April 2025.
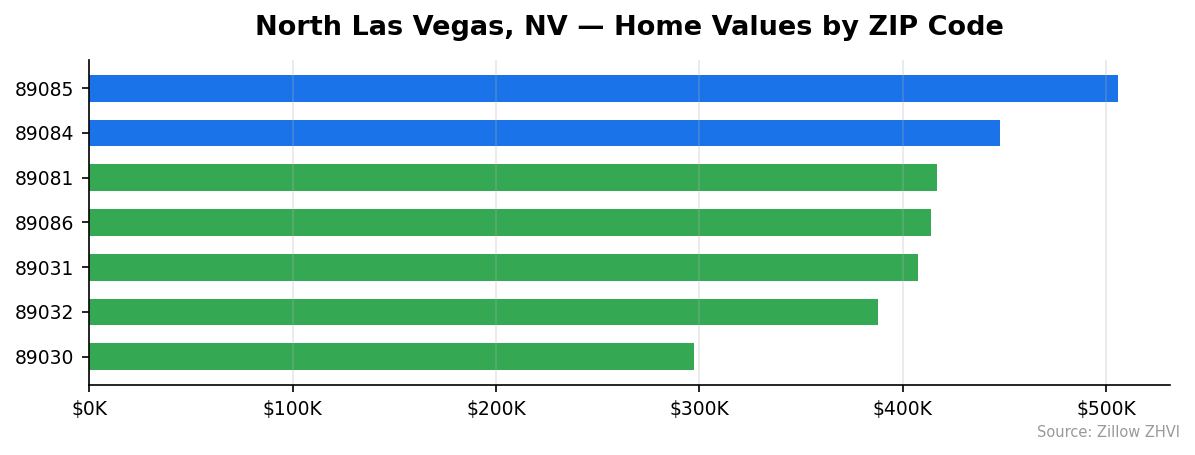
North Las Vegas Home Prices by Neighborhood
Not all ZIP codes are moving in the same direction at the same speed. Here’s how each neighborhood stacks up.
| ZIP Code | Median Home Value | Avg Monthly Rent |
|---|---|---|
| 89085 | $505,833 | Data not available |
| 89084 | $447,641 | $1,872 |
| 89081 | $416,937 | $2,010 |
| 89086 | $413,639 | $1,637 |
| 89031 | $407,226 | $1,999 |
| 89032 | $387,873 | $1,653 |
| 89030 | $297,313 | $1,380 |
Most Expensive ZIP Codes
89085 leads the city at $505,833 — about 23% above the city median, making it the clear premium neighborhood in North Las Vegas.
89084 comes in at $447,641 with average rents of $1,872/month, a relatively moderate rent-to-value ratio suggesting strong owner-occupancy.
89081 sits at $416,937, just above the citywide average, with the highest rents in the city at $2,010/month.
Most Affordable ZIP Codes
89030 is the entry point at $297,313 — nearly $114,000 below the city median. Rents here are the lowest too, at $1,380/month.
89032 offers homes at $387,873, about 6% under the citywide median, with rents of $1,653/month.
89031 comes in at $407,226, just a hair below the city average, with rents near $2,000/month — one of the tighter rent-to-price ratios in town.
Rent vs Buy in North Las Vegas
The average rent across North Las Vegas ZIP codes with available data runs about $1,758 per month.
Now compare that to buying. A mortgage on the median $410,923 home — assuming 20% down and a 7% rate on a 30-year fixed loan — puts your monthly principal and interest near $2,190. Add property taxes and insurance, and you’re looking at roughly $2,500 to $2,700 per month in total housing costs.
| Scenario | Monthly Cost |
|---|---|
| Average rent (citywide) | ~$1,758 |
| Mortgage P&I (20% down, 7%) | ~$2,190 |
| Estimated total ownership cost | ~$2,500–$2,700 |
Renting is cheaper by $400 to $900 per month depending on the neighborhood. But that math shifts in the most affordable areas. In 89030, rent is $1,380/month. A mortgage on a $297,313 home at the same terms would cost about $1,582 in principal and interest — a much narrower gap.
If you’re buying for the long term and want equity, the premium over renting is manageable in the lower-priced ZIP codes. In the pricier neighborhoods, renting looks like the better deal on a pure cash-flow basis.
Population Growth and Migration
North Las Vegas is one of the fastest-growing cities in Nevada. The population hit 294,034 in 2024, up from 261,173 in 2020. That’s a 12.6% increase in four years.
| Year | Population |
|---|---|
| 2020 | 261,173 |
| 2021 | 271,063 |
| 2022 | 280,093 |
| 2023 | 286,692 |
| 2024 | 294,034 |
The city has added roughly 8,000 residents per year. Growth hasn’t slowed — the 2023-to-2024 jump of 7,342 is in line with prior years.
How does that compare to the rest of the state?
| City | 2024 Population | 4-Year Growth |
|---|---|---|
| North Las Vegas | 294,034 | 12.6% |
| Henderson | 350,039 | 9.8% |
| Reno | 281,714 | 6.3% |
| Las Vegas | 678,922 | 4.8% |
| Sparks | 111,520 | 2.4% |
| Carson City | 58,148 | -0.9% |
North Las Vegas is growing more than twice as fast as Las Vegas proper and three times faster than Reno. That kind of population pressure normally pushes prices up. The fact that prices are falling despite strong in-migration suggests supply is keeping pace — for now.
North Las Vegas Housing Market Trends
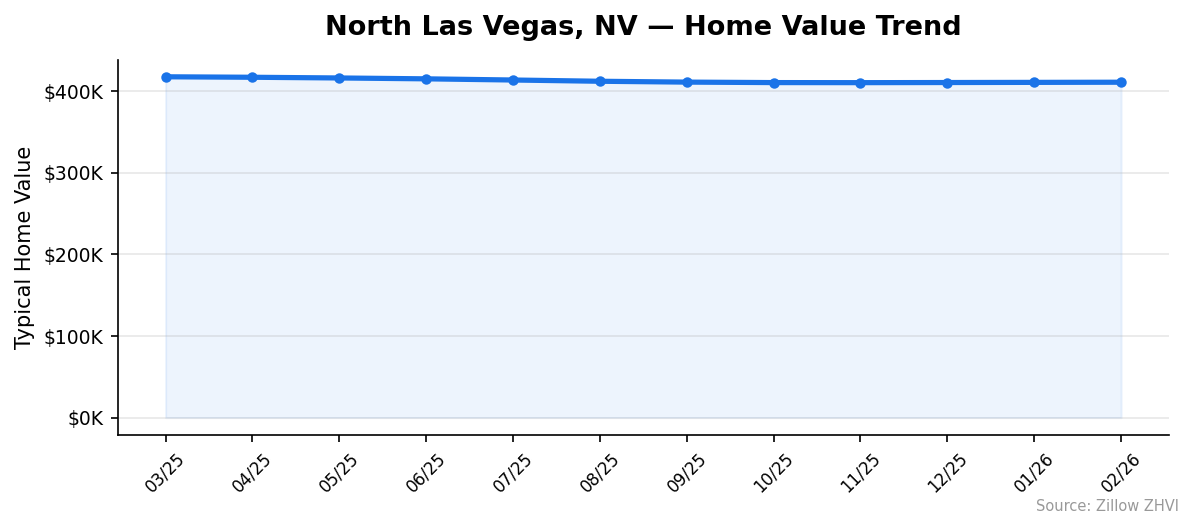
Here’s how the median home value has moved over the past 12 months.
| Month | Median Value | Low | High |
|---|---|---|---|
| Feb 2026 | $410,923 | $297,313 | $505,833 |
| Jan 2026 | $410,731 | $297,134 | $505,809 |
| Dec 2025 | $410,543 | $297,013 | $505,480 |
| Nov 2025 | $410,390 | $297,014 | $504,976 |
| Oct 2025 | $410,474 | $297,214 | $504,792 |
| Sep 2025 | $411,050 | $297,883 | $504,976 |
| Aug 2025 | $412,094 | $298,986 | $505,436 |
| Jul 2025 | $413,628 | $300,679 | $506,299 |
| Jun 2025 | $415,065 | $302,127 | $507,306 |
| May 2025 | $416,135 | $303,674 | $507,713 |
| Apr 2025 | $416,994 | $304,827 | $508,012 |
| Mar 2025 | $417,576 | $306,009 | $507,849 |
Prices peaked in March 2025 at $417,576 and have declined every month since, with one tiny exception — a $84 uptick in October. The total drop from peak to February 2026 is $6,653, or about 1.6%.
The decline has been flattening. From March to September 2025, prices fell about $6,500. From September 2025 to February 2026, they fell only about $127. The descent is running out of momentum.
Is North Las Vegas a Good Place to Buy in 2026?
The numbers point to a market that slightly favors buyers. Prices are lower than a year ago. The decline, while small, gives you negotiating room that didn’t exist in 2024.
Here’s what the data says in your favor: the median is down 1.6% year over year, the monthly declines have been tiny since fall 2025, and the most affordable ZIP code (89030) still offers homes under $300,000 in a metro area where that’s increasingly rare.
The risk? Population growth of 12.6% in four years means demand isn’t going away. If supply tightens, the current buyer-friendly window could close. North Las Vegas also has wide price variation — you can find a $297,000 home or a $506,000 home depending on the neighborhood.
For buyers with a long time horizon, the combination of flat-to-declining prices and strong population growth creates an opportunity. For those watching monthly cash flow, the cheaper ZIP codes make the rent-vs-buy math much more competitive.
North Las Vegas Housing Market Outlook for 2026-2027
The 3-month trend from December 2025 through February 2026 shows prices essentially flat — rising just $380 over that period. That’s after eight months of gradual decline.
If the current pace continues, prices are likely to stabilize in the $410,000 to $412,000 range through mid-2026. The sharp declines of spring and summer 2025 appear to have run their course.
The monthly trend suggests the market is finding a floor. The decline from peak was orderly — no single month saw a drop greater than $1,500. That kind of slow correction tends to stabilize rather than accelerate.
With population still growing at roughly 8,000 new residents per year, the demand side isn’t weakening. A return to price growth later in 2026 is plausible if mortgage rates ease, but the data doesn’t support predicting a strong rebound.
Similar Markets in NV
If you’re shopping in North Las Vegas, these nearby Nevada cities are worth comparing.
- Las Vegas — The larger neighbor with slower population growth at 4.8%, which may mean a more stable but pricier market.
- Henderson — Growing at 9.8% with a larger population base of 350,039, Henderson often runs at a premium to North Las Vegas.
- Sparks — A smaller market in northern Nevada that could appeal to buyers who want distance from the Las Vegas metro.
- Reno — Growing at 6.3% and nearly the same population as North Las Vegas, Reno offers a different climate and economy.
- Carson City — The state capital is actually losing residents (-0.9%), which could mean softer pricing for buyers willing to relocate.
Frequently Asked Questions
What is the average home price in North Las Vegas?
The average home price in North Las Vegas is $410,923 as of February 2026. This represents the median across 7 tracked ZIP codes, where values range from $297,313 in the 89030 area to $505,833 in the 89085 area.
Are home prices going up or down in North Las Vegas?
Prices are down 1.6% compared to a year ago. The decline started in March 2025 from a peak of $417,576 and has been gradual — averaging less than $1,000 per month. Since December 2025, the decline has nearly stopped, with prices holding steady around $410,000 to $411,000.
Is it cheaper to rent or buy in North Las Vegas?
Renting is cheaper in most neighborhoods. The average rent across the city is about $1,758/month, while a mortgage on the median home runs approximately $2,190/month in principal and interest alone. The gap is smallest in ZIP code 89030, where rents of $1,380 are closer to the estimated mortgage payment of about $1,582.
What is the most affordable neighborhood in North Las Vegas?
ZIP code 89030 is the most affordable at $297,313 — roughly 28% below the citywide median. It also has the lowest average rent at $1,380/month. The next most affordable is 89032 at $387,873.
Methodology
Home values are based on the Zillow Home Value Index (ZHVI), a smoothed measure of typical home values in the 35th to 65th percentile range. Rent estimates use the Zillow Observed Rent Index (ZORI). Population figures come from the U.S. Census Bureau Population Estimates Program (2020-2024 vintage). All datasets are publicly available. Housing data updated 2026-02-28.