North Miami Home Prices: $415K, Down 4.6% — 3 ZIPs Analyzed (2026)
$415,157. That’s what a typical home costs in North Miami right now — and it’s falling. The median home price dropped 4.6% compared to last year, extending a downward slide that started in spring 2025.
Quick answer: The average home price in North Miami, FL is $415,157 as of February 2026, down 4.6% year over year according to Zillow.
Current Home Prices in North Miami
North Miami sits within the Miami-Fort Lauderdale-Pompano Beach metro area, and the numbers tell a clear story of correction.
| Metric | Value |
|---|---|
| Median Home Price | $415,157 |
| Year-over-Year Change | -4.6% |
| Lowest ZIP Median | $319,522 |
| Highest ZIP Median | $479,431 |
| ZIP Codes Tracked | 3 |
| Data As Of | February 2026 |
The gap between the cheapest and most expensive ZIP code is roughly $160,000. That spread matters — it means your budget determines not just the size of your home but which part of the city you’re looking at.
A year ago, the citywide median was closer to $435,000. The 4.6% decline translates to about $20,000 in lost value on a typical home. For sellers, that stings. For buyers who’ve been priced out of South Florida, it’s an opening.
The price range across North Miami’s three tracked ZIP codes suggests a market with distinct tiers. You can still find entry-level options under $320,000 or stretch toward $480,000 in the priciest pocket.
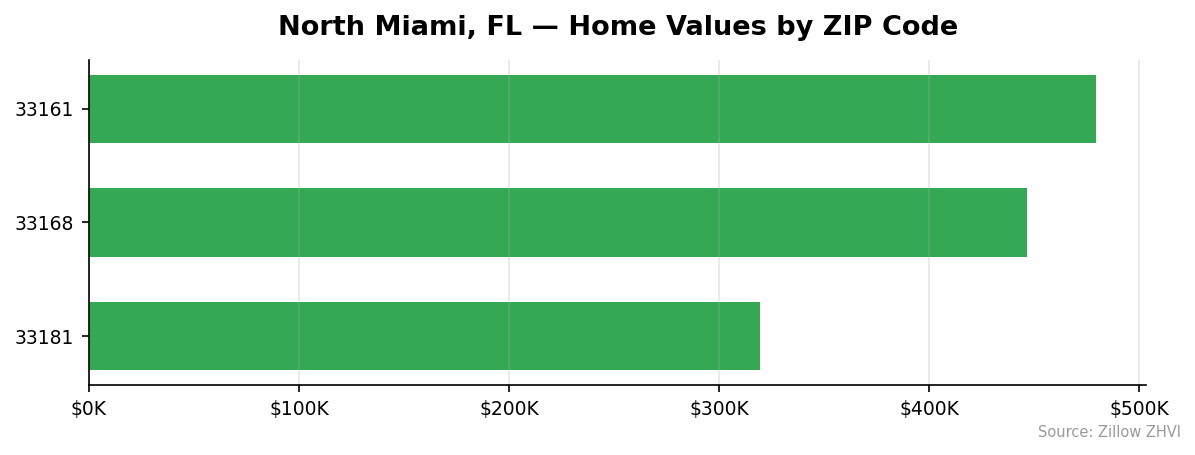
North Miami Home Prices by Neighborhood
All three tracked ZIP codes in North Miami show different price points and rent levels.
| ZIP Code | Median Home Value | Median Rent |
|---|---|---|
| 33161 | $479,431 | $2,246/mo |
| 33168 | $446,520 | $2,892/mo |
| 33181 | $319,522 | $2,586/mo |
Most Expensive
33161 leads at $479,431 — about 15% above the city median. Despite having the highest home values, this ZIP has the lowest rent at $2,246 per month, which could signal stronger owner-occupancy rates.
33168 sits at $446,520 with the highest rents in the city at $2,892 per month. That rent-to-price ratio makes it the most expensive area for tenants.
Most Affordable
33181 is the clear budget pick at $319,522 — nearly $96,000 below the citywide average and $160,000 less than the priciest ZIP. Rents here run $2,586, which is mid-range for the city. Buyers looking for the lowest entry point in North Miami should start here.
Rent vs Buy in North Miami
Rents in North Miami range from $2,246 to $2,892 depending on the ZIP code. The citywide average across all three ZIPs comes out to roughly $2,575 per month.
Now compare that to buying. On a $415,157 home with 20% down ($83,031), you’d finance about $332,126. At a 7% mortgage rate over 30 years, that’s roughly $2,210 in principal and interest alone. Add property taxes, homeowner’s insurance, and Florida’s flood insurance costs, and you’re looking at $2,700 to $3,000 per month in total housing costs.
| Renting | Buying | |
|---|---|---|
| Monthly Cost | $2,246–$2,892 | ~$2,700–$3,000* |
| Upfront Cost | Security deposit | ~$83,000 down |
| Equity | None | Yes |
| Maintenance | Landlord | You |
*Estimated: P&I + taxes + insurance on median-priced home, 20% down, 7% rate.
For most people, renting is cheaper on a monthly basis — especially in ZIP 33161 where rent runs $2,246 versus a mortgage payment well north of that. The math shifts if you plan to stay five-plus years and build equity, but in a market that’s declining 4.6% annually, that equity isn’t guaranteed in the short term.
Population Growth and Migration
North Miami’s population reached 62,202 in 2024, up 4.0% from 59,831 in 2020. The city is growing, though it took a small dip in 2021 before rebounding.
| Year | Population |
|---|---|
| 2020 | 59,831 |
| 2021 | 59,050 |
| 2022 | 59,751 |
| 2023 | 60,899 |
| 2024 | 62,202 |
That 2021 dip of about 780 residents coincided with pandemic-era migration patterns across South Florida. Since then, the city has added roughly 3,150 people in three years.
How does North Miami compare to other Florida cities?
| City | 2024 Population | 4-Year Growth |
|---|---|---|
| Port St. Lucie | 258,575 | 25.0% |
| Cape Coral | 233,025 | 19.2% |
| Miami | 487,014 | 10.0% |
| Orlando | 334,854 | 8.8% |
| Tampa | 414,547 | 6.7% |
| North Miami | 62,202 | 4.0% |
North Miami’s 4.0% growth rate is the slowest on this list. Larger Florida cities are absorbing residents at a much faster pace. Port St. Lucie grew 25% in the same period. That slower growth may be one factor behind falling home prices — demand isn’t rising fast enough to support 2025 valuations.
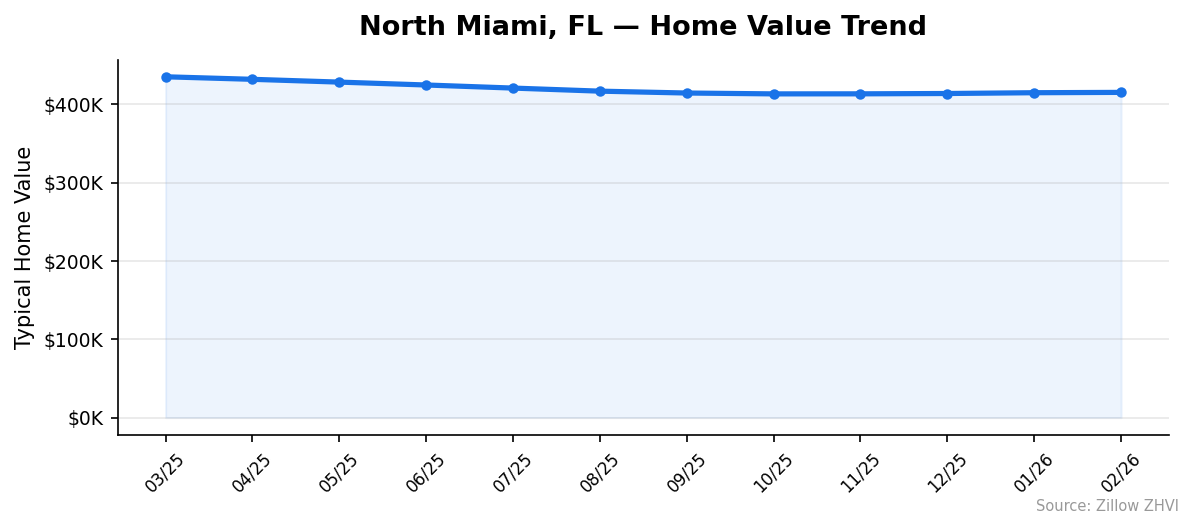
North Miami Housing Market Trends
The 12-month trend shows a steady decline from a peak near $435,000 in March 2025.
| Month | Avg Home Value | Low | High |
|---|---|---|---|
| Mar 2025 | $435,066 | $352,027 | $487,270 |
| Apr 2025 | $431,834 | $348,660 | $484,483 |
| May 2025 | $428,279 | $344,560 | $482,284 |
| Jun 2025 | $424,587 | $340,464 | $479,868 |
| Jul 2025 | $420,651 | $335,745 | $476,998 |
| Aug 2025 | $416,727 | $331,066 | $473,575 |
| Sep 2025 | $414,338 | $327,220 | $471,913 |
| Oct 2025 | $413,245 | $324,157 | $472,210 |
| Nov 2025 | $413,308 | $322,552 | $473,634 |
| Dec 2025 | $413,731 | $321,327 | $475,707 |
| Jan 2026 | $414,730 | $320,679 | $478,012 |
| Feb 2026 | $415,157 | $319,522 | $479,431 |
The sharpest drops happened between March and September 2025, when the median fell about $21,000 in six months. Since October, prices have flattened out near $413,000–$415,000. The bottom ZIP code (33181) continued sliding from $352,027 to $319,522 over the full 12 months, while the top ZIP appears to have stabilized.
That flattening in late 2025 and early 2026 is worth watching. It could signal that the correction is running out of steam.
Is North Miami a Good Place to Buy in 2026?
The data points toward a buyer’s market. Prices are down 4.6%, the decline has been consistent for 11 straight months, and population growth is modest at 4.0% over four years.
Buyers have negotiating room they didn’t have in 2024. A home that would have cost $435,000 a year ago now costs $415,000. That $20,000 difference means lower monthly payments and a smaller down payment.
But there are cautions. Renting is still cheaper on a monthly basis in most ZIP codes. And buying into a declining market means your home could be worth less next year than what you paid. If you’re planning to stay five or more years, the current prices and the flattening trend could work in your favor. If you need to sell in two years, the risk is real.
The strongest buy case is in ZIP 33181, where homes sit at $319,522. At that price point, the monthly mortgage math gets closer to parity with rents.
North Miami Housing Market Outlook for 2026-2027
The 12-month trend shows two distinct phases: a steady drop from March to October 2025, then a leveling off from October 2025 through February 2026. Over the last four months, the median moved less than $2,000 total.
If the current pace continues, expect prices to hover in the $413,000–$418,000 range through mid-2026. The steep correction appears to be over. What’s left looks more like a slow drift than a freefall.
The high end of the market (ZIP 33161) has actually ticked up from $471,913 in September to $479,431 in February. The low end (33181) is still sliding. That divergence suggests the pricier neighborhoods may recover first while affordable pockets continue to adjust.
Nothing in the data suggests a sharp rebound or a second leg down. Flat is the most likely direction for the next three to six months.
Similar Markets in FL
If you’re shopping in the North Miami area, these Florida cities offer different price points and market conditions:
- Fort Lauderdale — Just north of North Miami in the same metro area, a natural comparison for Broward County buyers.
- Hialeah — Neighboring city in Miami-Dade with a different price profile and strong rental market.
- Pembroke Pines — Suburban option between Miami and Fort Lauderdale for buyers wanting more space.
- Miramar — Another Broward County suburb popular with families moving out of Miami-Dade.
- Homestead — South of Miami with typically lower price points for budget-conscious buyers.
Frequently Asked Questions
What is the average home price in North Miami?
The average home price in North Miami is $415,157 as of February 2026. Prices vary widely by ZIP code, from $319,522 in 33181 to $479,431 in 33161. The citywide median has dropped about $20,000 since March 2025.
Are home prices going up or down in North Miami?
Down. North Miami home prices have fallen 4.6% year over year. The decline started around March 2025 and continued through the fall, though the pace has slowed significantly since October. The market appears to be stabilizing near current levels.
Is it cheaper to rent or buy in North Miami?
Renting is generally cheaper. Monthly rents range from $2,246 to $2,892 across the city’s three ZIP codes. A mortgage on the median-priced home — with 20% down at 7% interest — runs roughly $2,700 to $3,000 when you include taxes and insurance. The gap narrows in ZIP 33181 where home prices are lowest.
What is the most affordable neighborhood in North Miami?
ZIP code 33181 has the lowest median home value at $319,522, about $96,000 below the citywide average. Rents there are $2,586 per month. It’s the only North Miami ZIP where you can buy under $325,000.
Methodology
Home values are based on the Zillow Home Value Index (ZHVI), a smoothed measure of typical home values in the 35th to 65th percentile range. Rent estimates use the Zillow Observed Rent Index (ZORI). Population figures come from the U.S. Census Bureau Population Estimates Program (2020-2024 vintage). All datasets are publicly available. Housing data updated 2026-02-28.